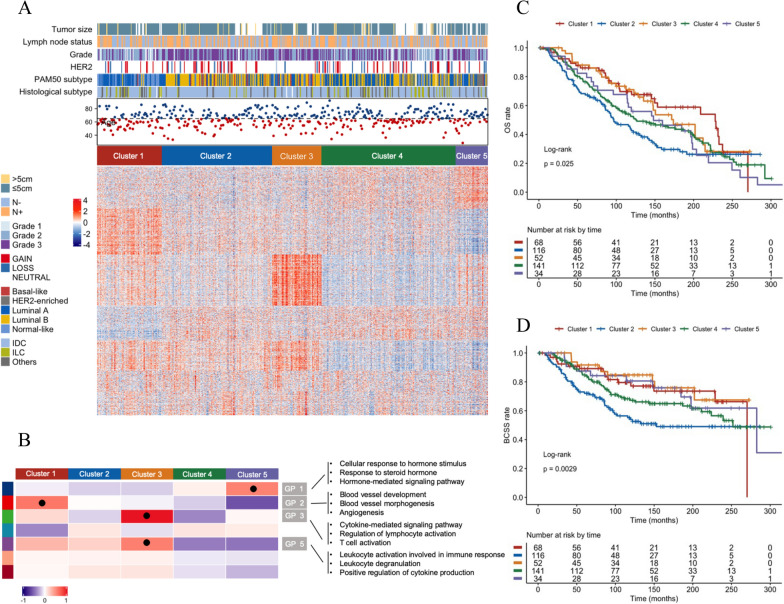
Fig. 1.
Immune subtypes and gene programmes defining ER+/PR−/HER2− breast cancer. A Unsupervised clustering analysis of microarray data identified five immune subtypes. B Heatmap of gene programmes significantly enriched in ER+/PR−/HER2− breast cancer. Scores for gene programmes (GP scores) were defined as the average expression level of all genes in a particular module. In the heatmap, colors represent mean GP scores of each cluster and black dots denote modules showing highest significance for an individual subtype. C, D Kaplan–Meier analysis of patient survival stratified by cluster: C OS; D BCSS

