Fig. 4.
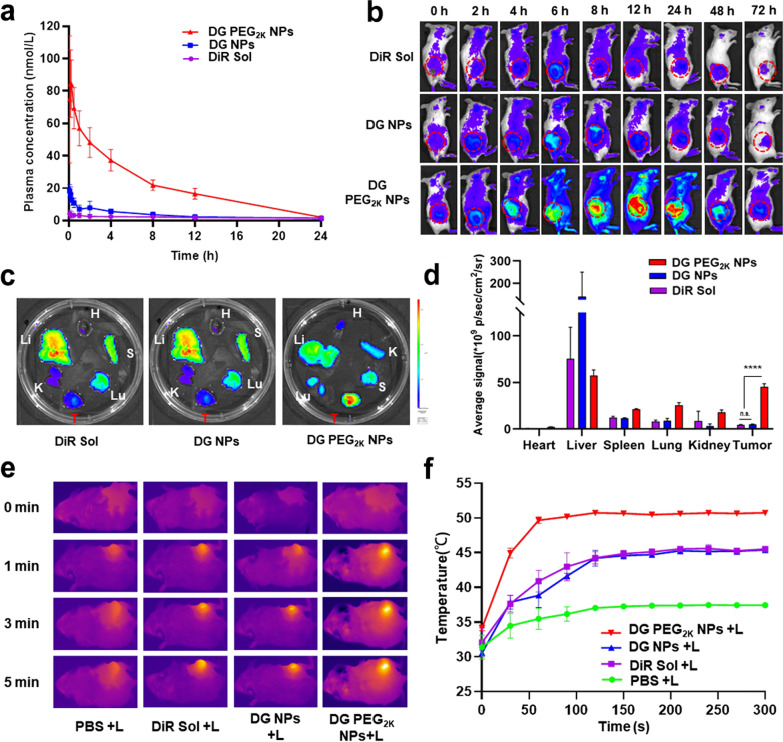
The pharmacokinetic profile and in vivo photothermal efficiency of DG PEG2K NPs. a The concentration–time curves of DiR Sol, DG NPs and DG PEG2K NPs at a DiR equivalent dose of 1 mg kg−1 (n = 6); b Living image of 4T1 tumor-bearing BALB/c mice treated with DiR Sol, DG NPs and DG PEG2K NPs at a DiR equivalent dose of 1 mg/kg (n = 3), the tumor is indicated by circles; c Ex vivo image of major organs and tumors at the peak point of tumor accumulating (6 h post-injection for DiR Sol and DG NPs and 12 h for DG PEG2K NPs); d Average fluorescence intensity of c ( n.s. no significance, ****P < 0.0001.); e Thermal imagery of tumor-bearing mice model after treated with PBS, DiR Sol, DG NPs and DG PEG2K NPs; f The corresponding temperature changing curves of photothermal imaging in tumor site under laser treatment (808 nm, 3 W/cm2, 5 min)

