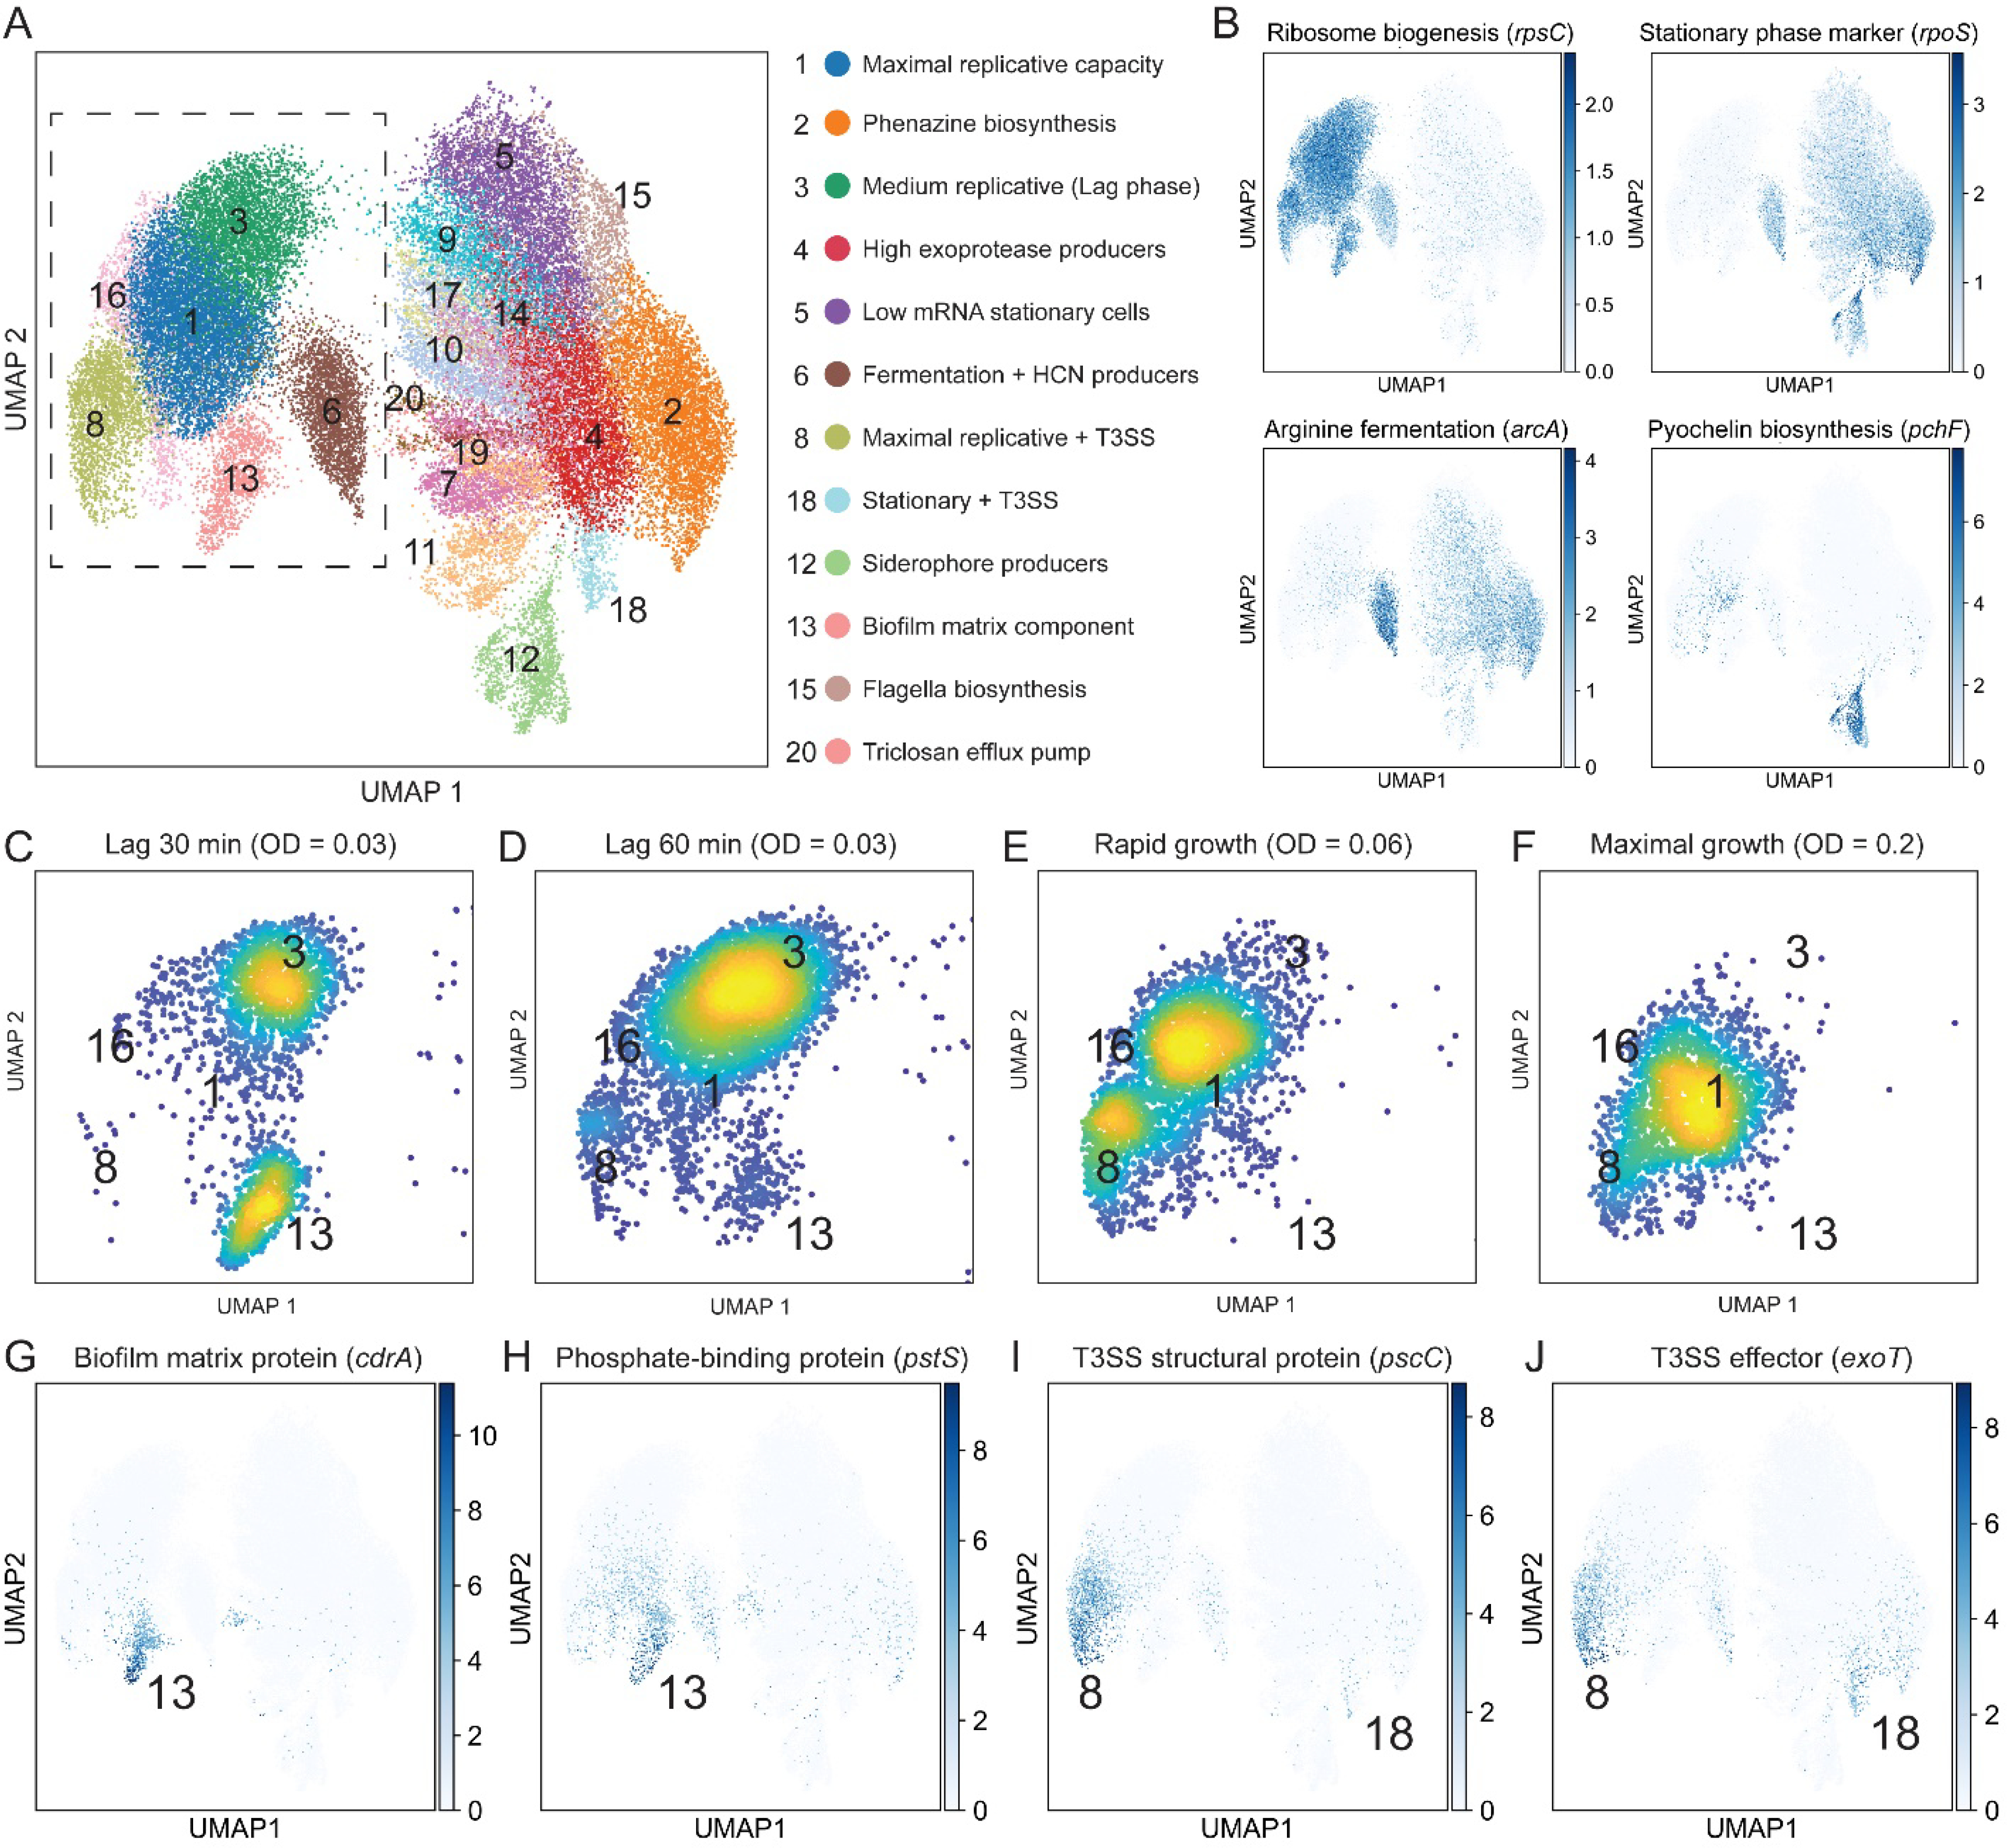
Fig. 3. Single-bacterium analysis reveals physiologically distinct dynamic sub-populations.

(A) UMAP analysis using cells from all 11 time points. Identified clusters are shown in different colors and are indexed by group size. Specific group and their enriched functions are shown to the right. (B) Gene expression overlays for four genes that report on metabolic state, stationary phase progression and exoproduct biosynthesis. The color map shows the normalized expression scaled to unit variance. Cells from all 11 time points are displayed in the plot (C-F) Density scatter plots of cells from individual conditions in a zoom-in of the UMAP (dashed box in panel A). The clusters are indicated by their index. (G-J) Gene expression overlays shown as in B.
