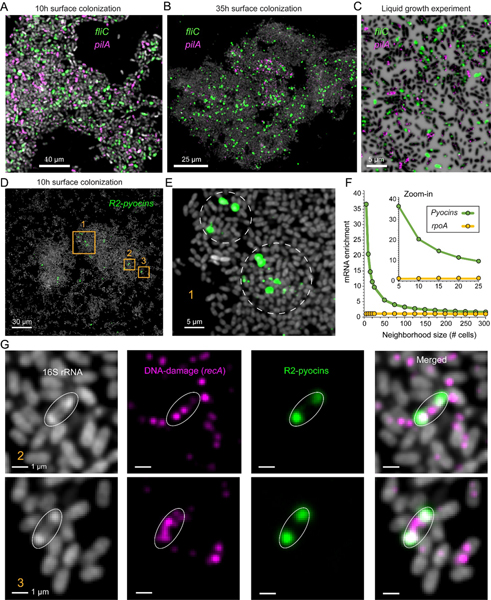
Fig. 5. Spatial expression patterns for motility and pyocin related genes.
(A-B) Representative regions from the 10h and 35h biofilm experiments, cells are shown in via 16S rRNA fluorescence (gray) and overlayed with raw mRNA-FISH fluorescence for different genes as indicated. (C) planktonic cells from the pair liquid experiments. Cells are shown via DAPI and expression as indicated (D-E) 10h aggregate showing R2-pyocin expression. (F) Enrichment of R2-Pyocin mRNA near strong induction sites (cell with 99.5th percentile pyocin expression). X-axis shows the number of cells closest to an induction site that were analyzed (neighborhood size; center cell was excluded). Y-axis shows the enrichment in each neighborhood relative to the total population. A non-pyocin control gene is shown (rpoA). (G) Examples of mRNA R-pyocin transcript and ribosome polar localization as indicated in the legends.

