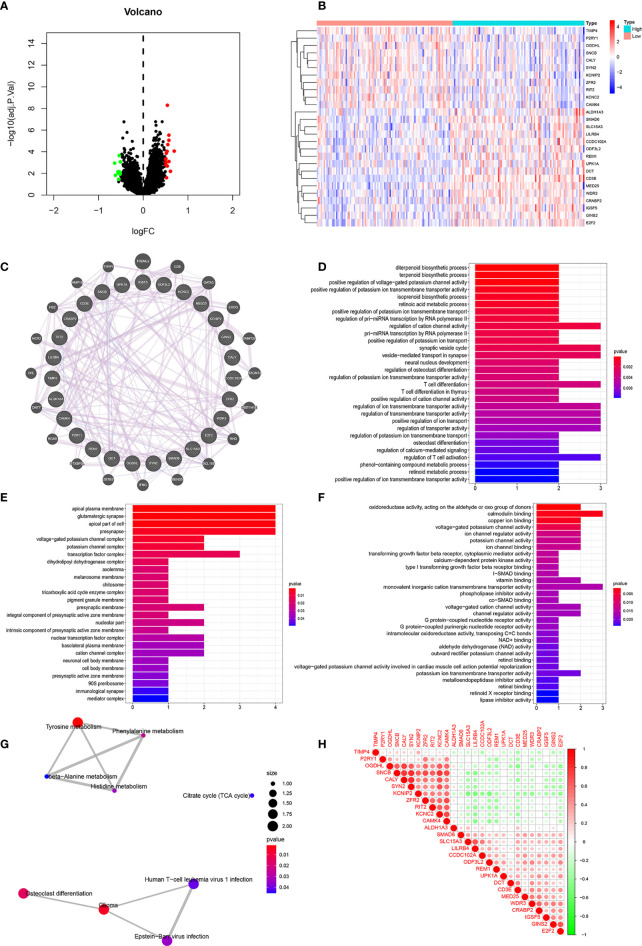
Figure 7.
Correlation Analyses of Clinical-Related DEGs (A) The volcano map of Clinical-Related DEGs. (B) The heat map of Clinical-Related DEGs. (C) PPI of Clinical-Related DEGs. co-expression (lavender line), co-localization (deep blue line). (D) The enrichments of biological processes of DEGs. (E) The enrichments of cellular components of DEGs. (F) The enrichments of molecular functions of DEGs. (G) The enrichments in KEGG pathway of DEGs. (H) The 20 most significantly up-regulated genes and the 20 most significantly down-regulated genes with CD3E. Red color was for positive correlation, and green color represented a negative correlation. The deeper the color indicated the greater the relevance.

