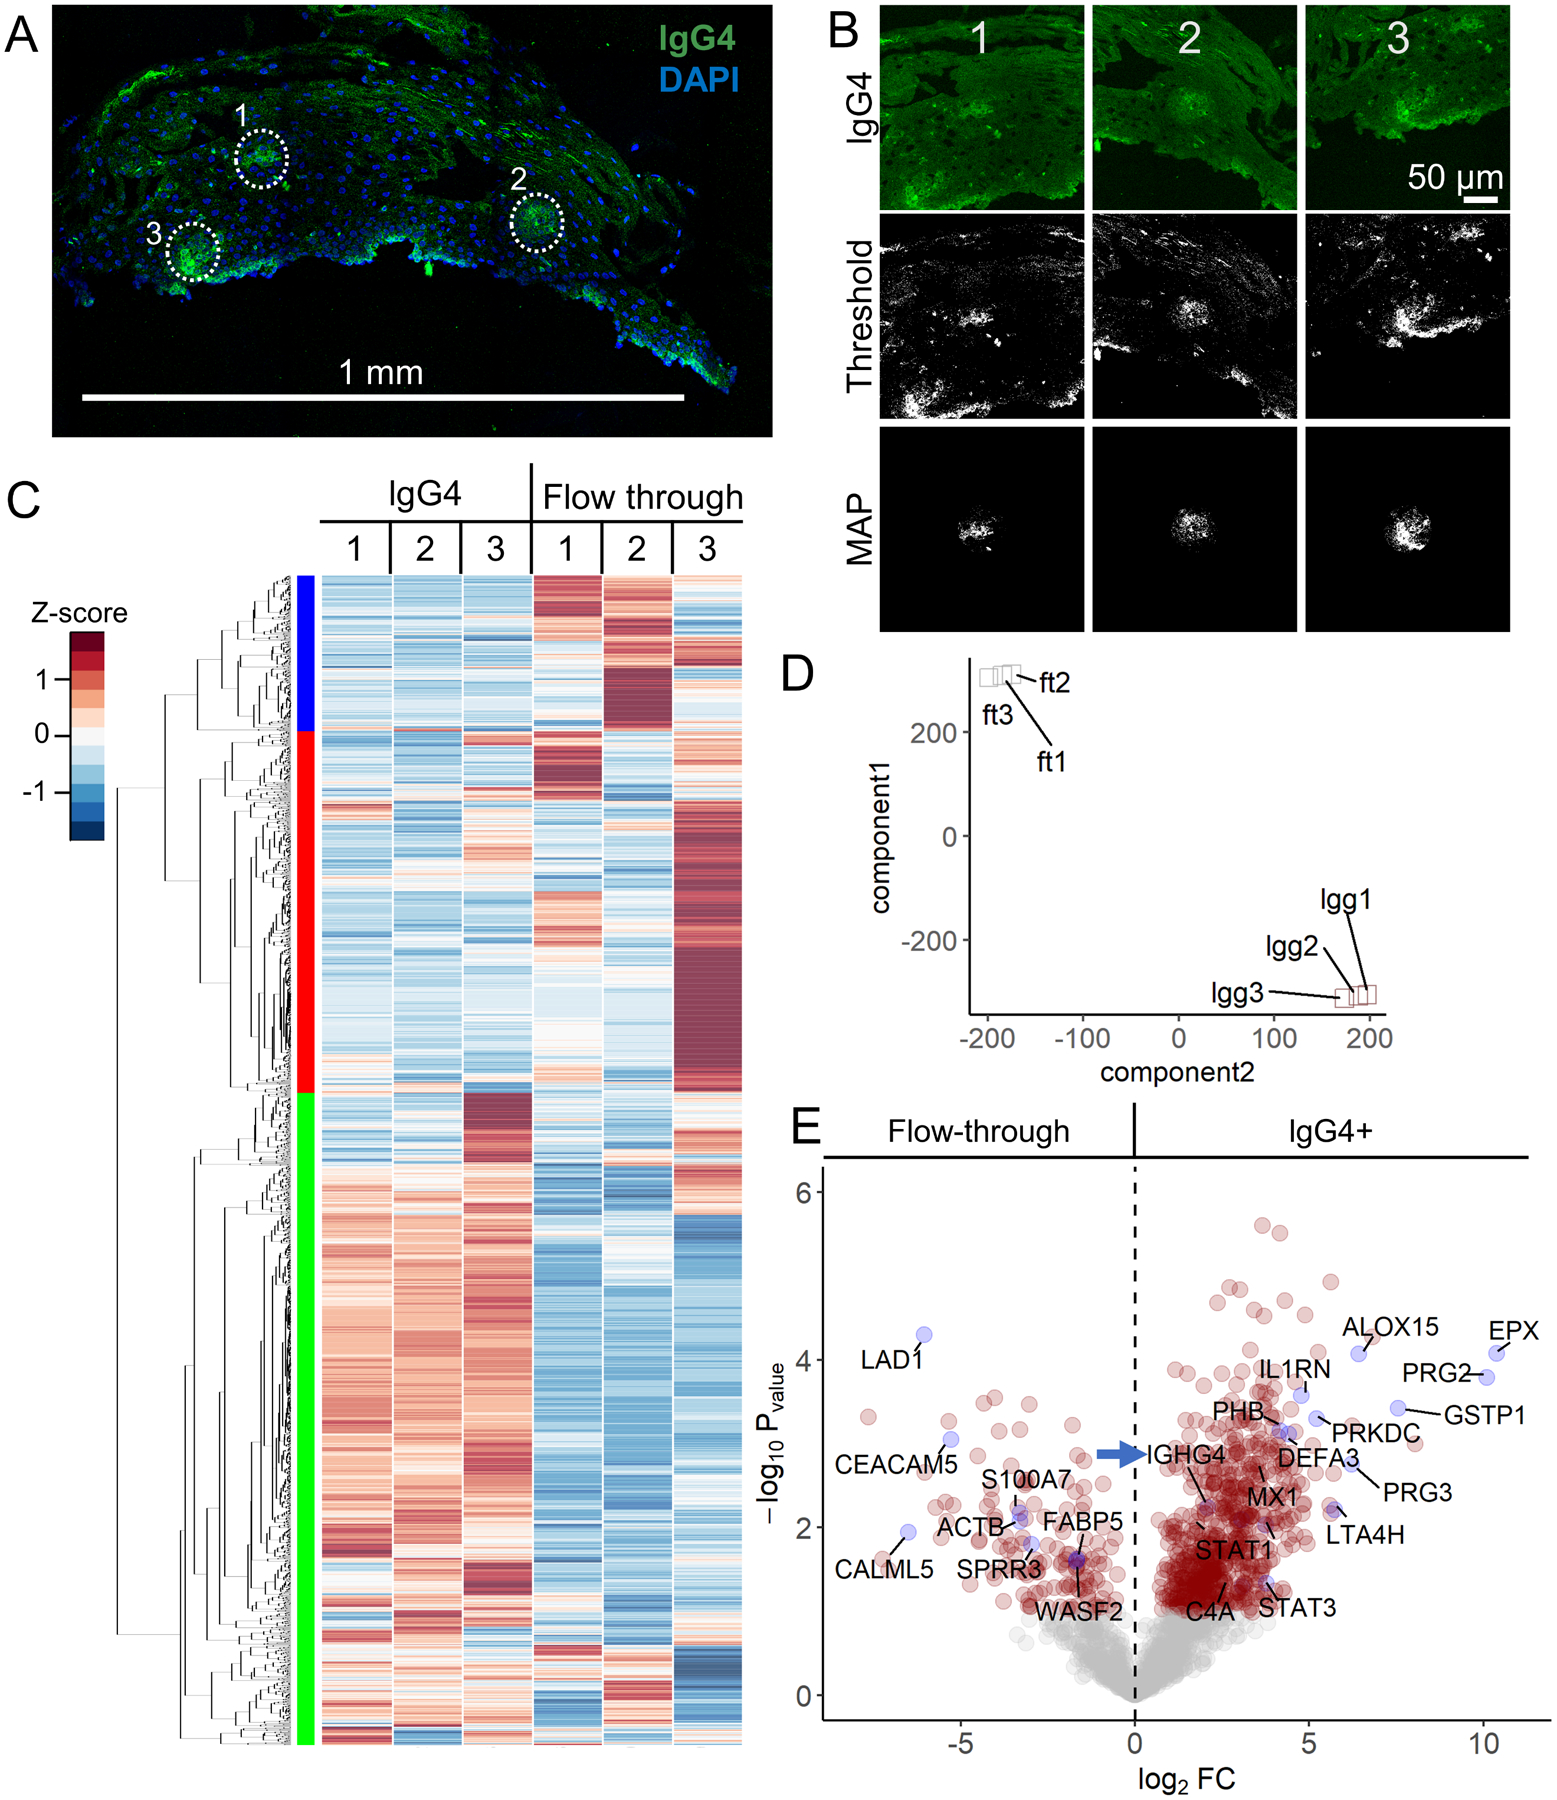
Figure 5. AutoSTOMP identifies eosinophil granule proteins associated with IgG4+ lesions in EoE patient esophagus biopsies.

A, Representative section of an EoE patient biopsy stained with an antibody specific to lgG4 (green) and counterstained with DAPI (blue). IgG4+ SOI are indicated by white dots, scale bar = 1 mm. B, Three representative SOI tile images, thresholded images and MAP files used to guide biotinylation of each SOI. C–D, Biotinylated proteins, the ‘lgG4’ fraction, or the unlabeled ‘flow through’ were isolated and identified as described in Figure 2A. Each sample represents sections pooled from two biopsies. C, 2,007 human proteins were identified and plotted by row z-score normalized across all the samples. Hierarchical clustering (left) indicates three enrichment groups. D, T-distributed stochastic neighborhood embedding (t-SNE) account for variation among the ‘lgG4’ fractions (lgg1, lgg2, lgg3) and ‘flow through’ fractions (ft1, ft2, ft3) across the three samples. E, Of the 2,007 proteins identified, 27.9% of were significantly enriched and 12.3% of the proteins were significantly lower in the ‘lgG4’ fractions relative to the ‘flow through’ fractions (red circles, p < 0.05, FDR < 0.1). Plotted as −log10 p-value (y axis) versus the log2 fold-change (x axis) of the protein abundance averaged between replicates with a false discovery of < 0.1. IgG4 positive control (IGHG4, blue arrow indicated) is noted. Some significantly expressed proteins annotated are in blue dots.
