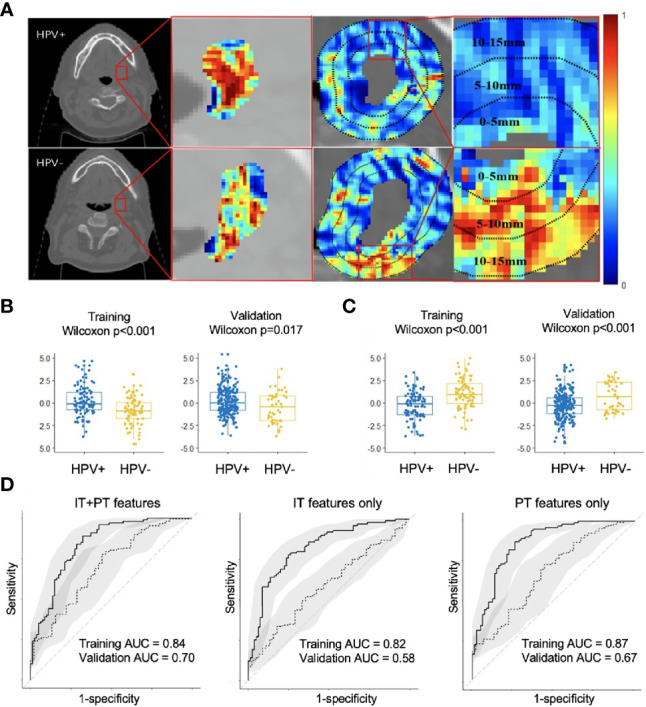
Figure 2.

Feature map for the best intratumoral and peritumoral features expressing differently on the example HPV+ and HPV− CT slices overlaid with either tumor or annular ring areas around the tumor (A). Boxplots showing distribution differences for the best intratumoral (B) and peritumoral feature (C) between HPV+ and HPV− patients in both training (ST) and validation (SV). Receiver operating characteristic (ROC) analysis of radiomic features for predicting HPV status on training (ST, n = 180) and validation (SV, n = 282) cohorts with confidence intervals (D). Using combined intratumoral and peritumoral features yielded the best result in SV. IT, intratumoral; PT, peritumoral.
