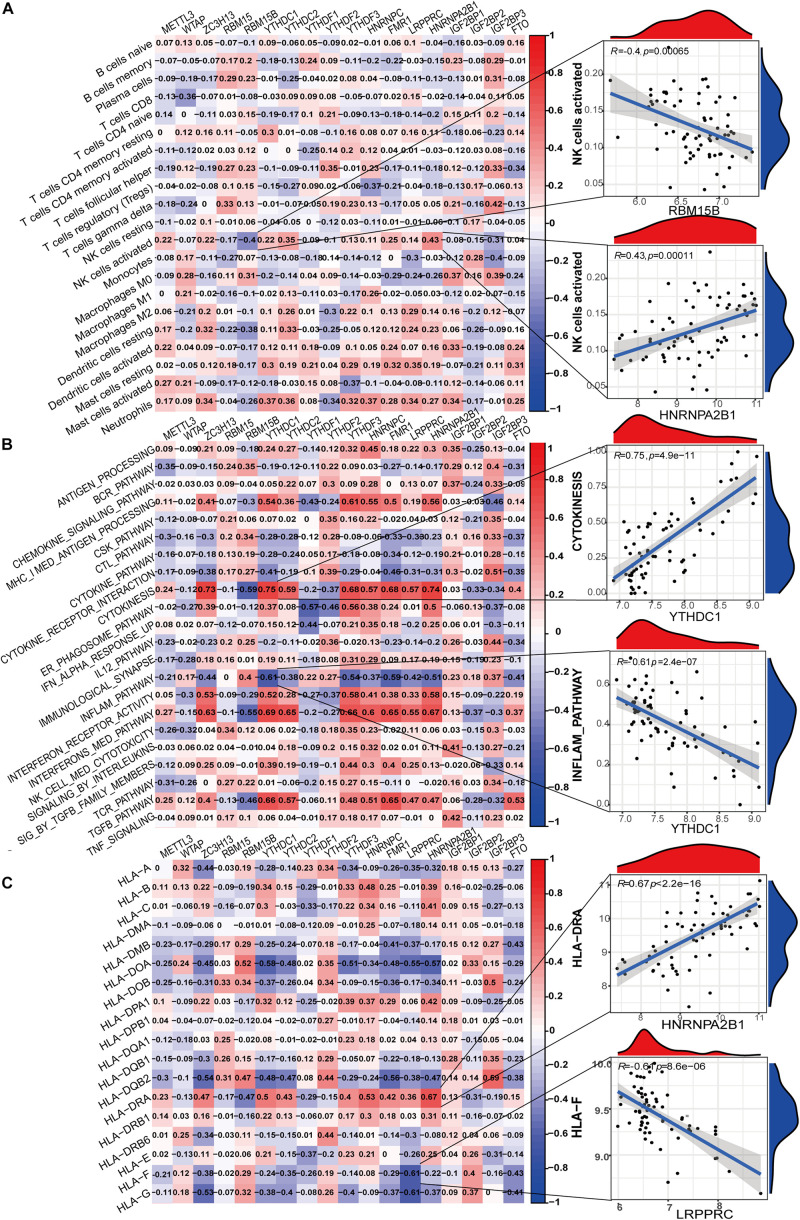
FIGURE 4.
Correlation between m6A regulator expression and immune characteristics in LN. (A) Heatmap of the correlations between 18 m6A regulators and 21 immunocytes (eosinophils with no expression were removed in all samples). The two respective scatterplots show the m6A regulator and immunocyte with the highest positive or negative correlation. (B) Heatmap of the correlations between 18 m6A regulators and immune response gene sets. The two respective scatterplots show m6A regulators and immune response gene sets with the highest positive or negative correlation. (C) Heatmap of the correlations between 18 m6A regulators and 18 HLA genes. The two respective scatterplots show m6A regulators and HLA genes with the highest positive or negative correlation.

