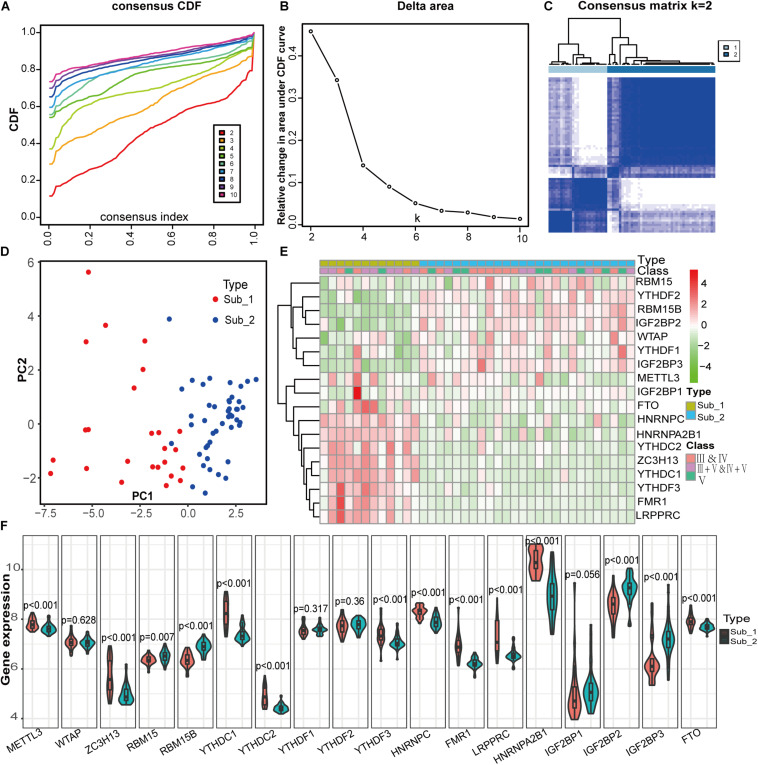
FIGURE 5.
Identification of two distinct m6A modification subtypes in LN and clinical correlation of two subtypes. (A) Consensus clustering of cumulative distribution function (CDF) for k = 2–9. (B) Elbow plot shows relative change in area under CDF curve. (C) Consensus clustering matrix for k = 2. (D) Principal component analysis (PCA) of two m6A subtypes in LN. (E) Heatmap of the clinical features of two clusters comparing the stages of LN and gene profiles between m6A subtypes in GSE127797. (F) The two m6A subtypes exhibit distinct expression statuses of 18 m6A RNA methylation regulators.

