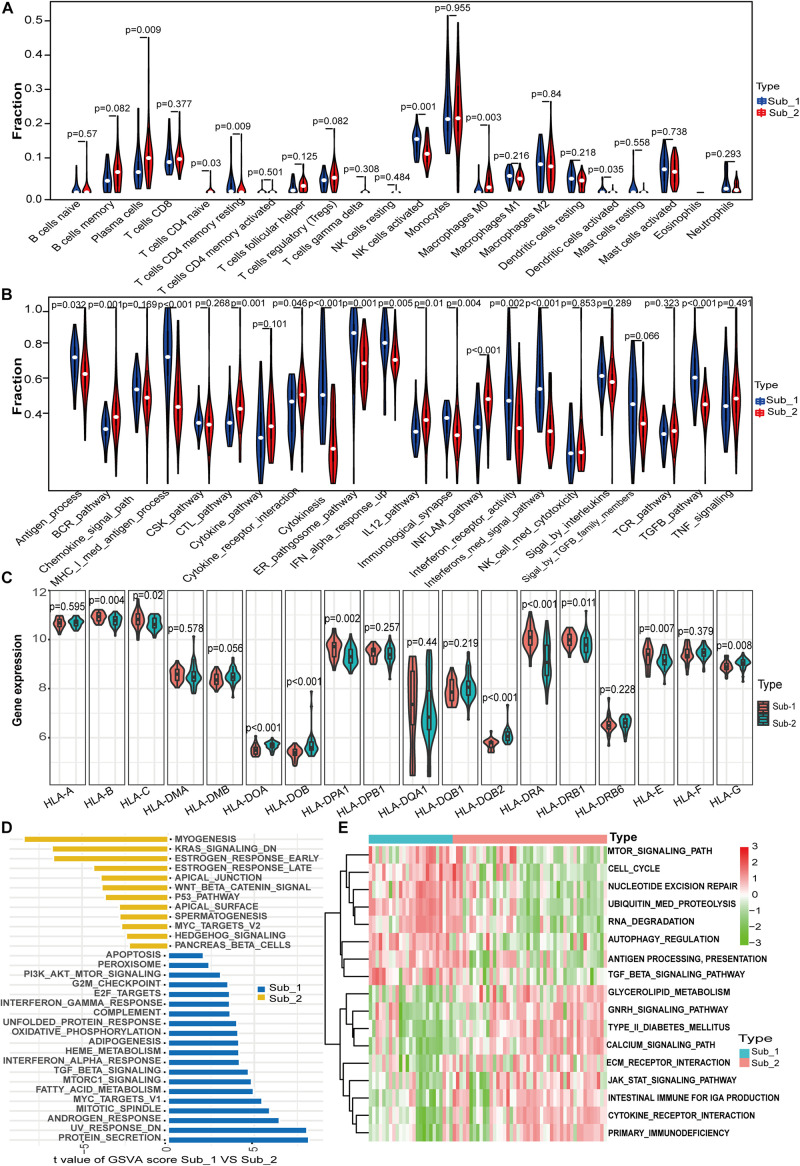
FIGURE 6.
Differences in immune characteristics between m6A subtypes and functional enrichment analysis in two m6A subtypes. (A) Differences in abundance of 22 infiltrating immunocytes. (B) Differences in the activity of 22 immune response gene sets in two m6A subtypes. (C) Expression differences of 18 HLA genes in two m6A subtypes. (D) Differences in HALLMARKS pathway enrichment between m6A subtypes. (E) KEGG pathways with significant differences in enrichment between m6A subtypes.

