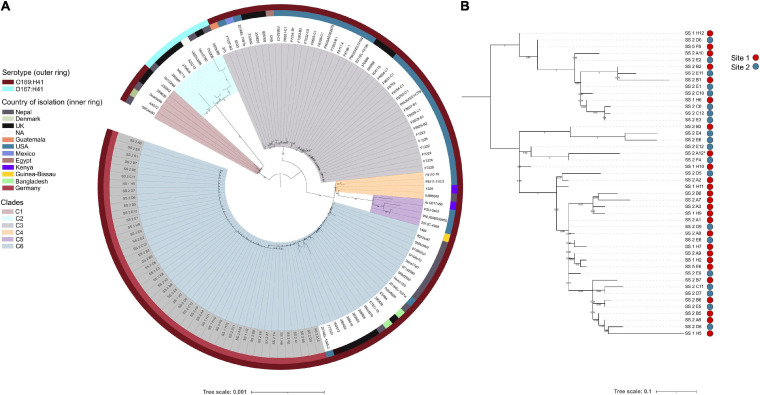
FIGURE 1.
E. coli ST182 phylogeny. (A) Mid-point root maximum-likelihood tree by core genome alignment showing genetic relatedness between 130 ST182 genomes. Isolates from this collection have tip label shaded in gray. Tree generated using IQTree2. (B) Mid-point rooted SNP-based phylogeny tree showing topology of the 46 airplane waste isolates only. Site 1: vacuum truck with waste from aircraft arriving from Mombasa, Canada, and Singapore. Site 2: Sewage from mixed aircraft tanks. Tree generated using Parsnp. Both trees visualised using iTOL.

