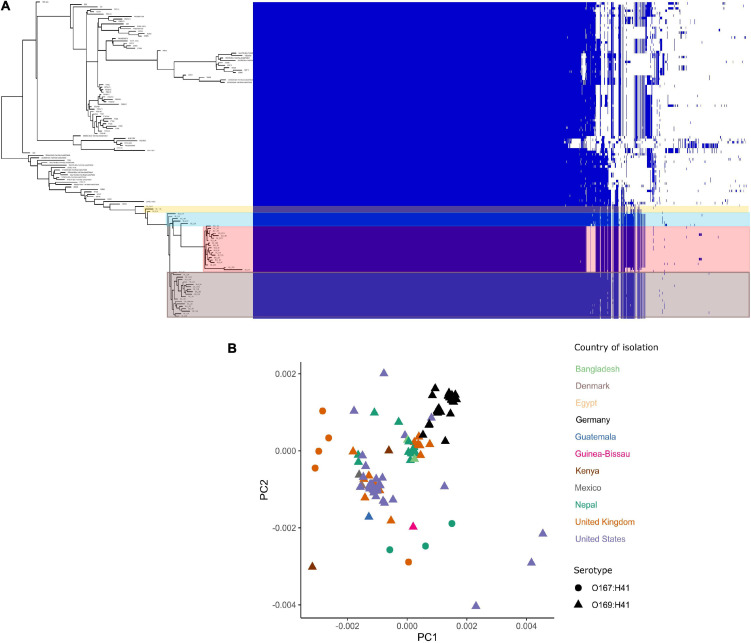
FIGURE 2.
E. coli ST182 pangenome. (A) Gene presence/absence matrix clustered by accessory genome visualised using Phandango. Airplane waste isolate clusters highlighted. (B) MDS illustrating pairwise genome distances calculated using Mash. Isolates colored by country of isolation. All originating from Germany (black) pertain to this collection. Shapes distinguish serotypes.

