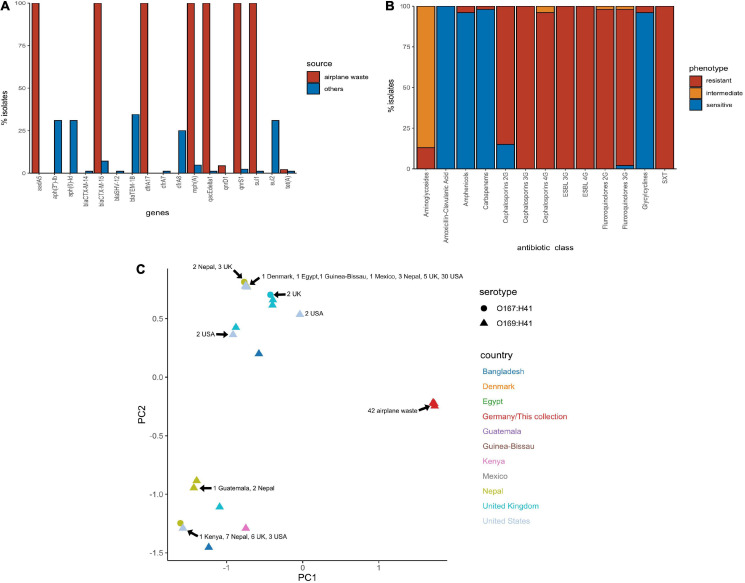
FIGURE 3.
Antimicrobial resistance (AMR) profile of E. coli ST182 strains. (A) Bar graph comparing distribution of the most common ARGs identified in both ST182 airplane waste isolates (red) and other ST182 strains (blue). (B) Phenotypic AMR profile of ST182 airplane waste isolates. Red = resistant isolates (%), orange = intermediate (%), blue = sensitive (%). (C) MDS analysis of ARGs detected in ST182 isolates. Where identical profiles cause shapes to overlap arrows have been added detailing the country of isolation for each clustered isolate.

