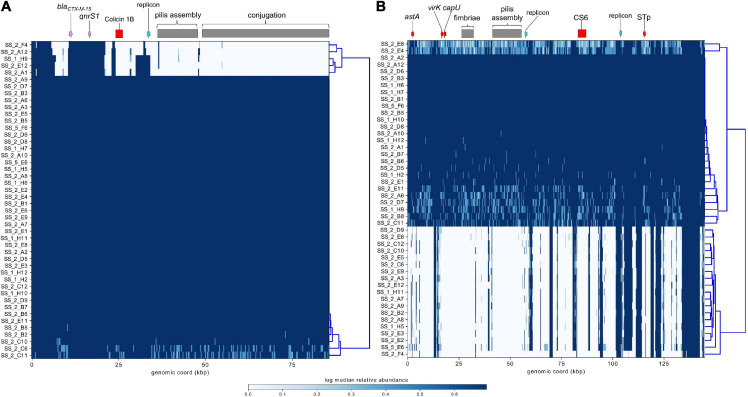
FIGURE 8.
Mapping of short-reads indicating the presence of IncB/O/K/Z and IncF plasmids. (A) Schematic and heatmap for IncB/O/K/Z plasmid from E. coli ST182 strain 2014EL-1345-2. (B) Schematic and heatmap for IncF plasmid from E. coli strain 2014EL-1345-2. Clustering of rows is based on the similarity between plasmid coverage profiles. Solid blue color indicates a read depth of over 20, and a light blue color indicates a read depth between 10 and 20.

