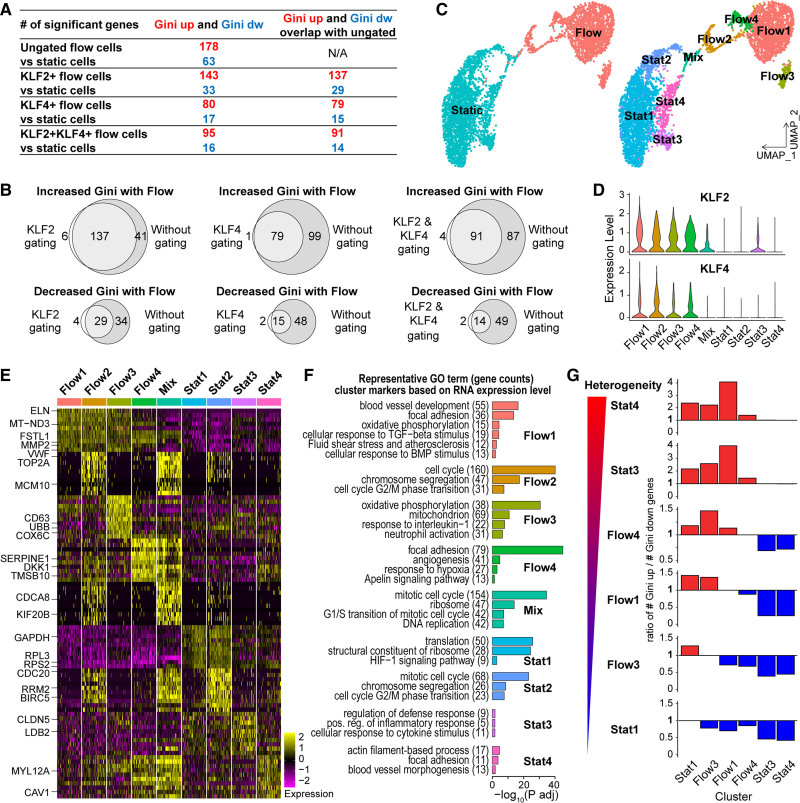
Figure 2.
Subpopulation analysis of endothelial cell (EC) under homeostatic laminar flow. A and B, Human umbilical vein ECs (HUVEC) flow samples gated based on expression of KLF2, KLF4, or both; differential Gini test performed between static and indicated flowed EC with DESCEND (deconvolution of single-cell expression distribution). A, Genes with significant Gini changes under flow by each gating criteria. B, Venn diagrams showing gene list overlap from gated vs ungated analysis (A). C–G, Subpopulation analyses. C, UMAP (Uniform Manifold Approximation and Projection) plots of HUVEC colored by condition (left) or subpopulations (right). D, Violin plots showing distribution of normalized KLF2 and KLF4 expression by subpopulation. E, Heatmap showing expression of top 10 cluster markers ranked by fold change. Left, representative genes for each cluster. F, Representative gene ontology terms for genes highly expressed in each cluster. G, Differential test of Gini performed between HUVEC subpopulations with DESCEND; ratio of genes showing increased Gini over genes showing decreased Gini for each pairing. Red bars, ratio >1. Blue bars, ratio <1.

