
Figure 1. Dysfunctional CD8 T cells in tumors and chronic infection share a common chromatin state space.
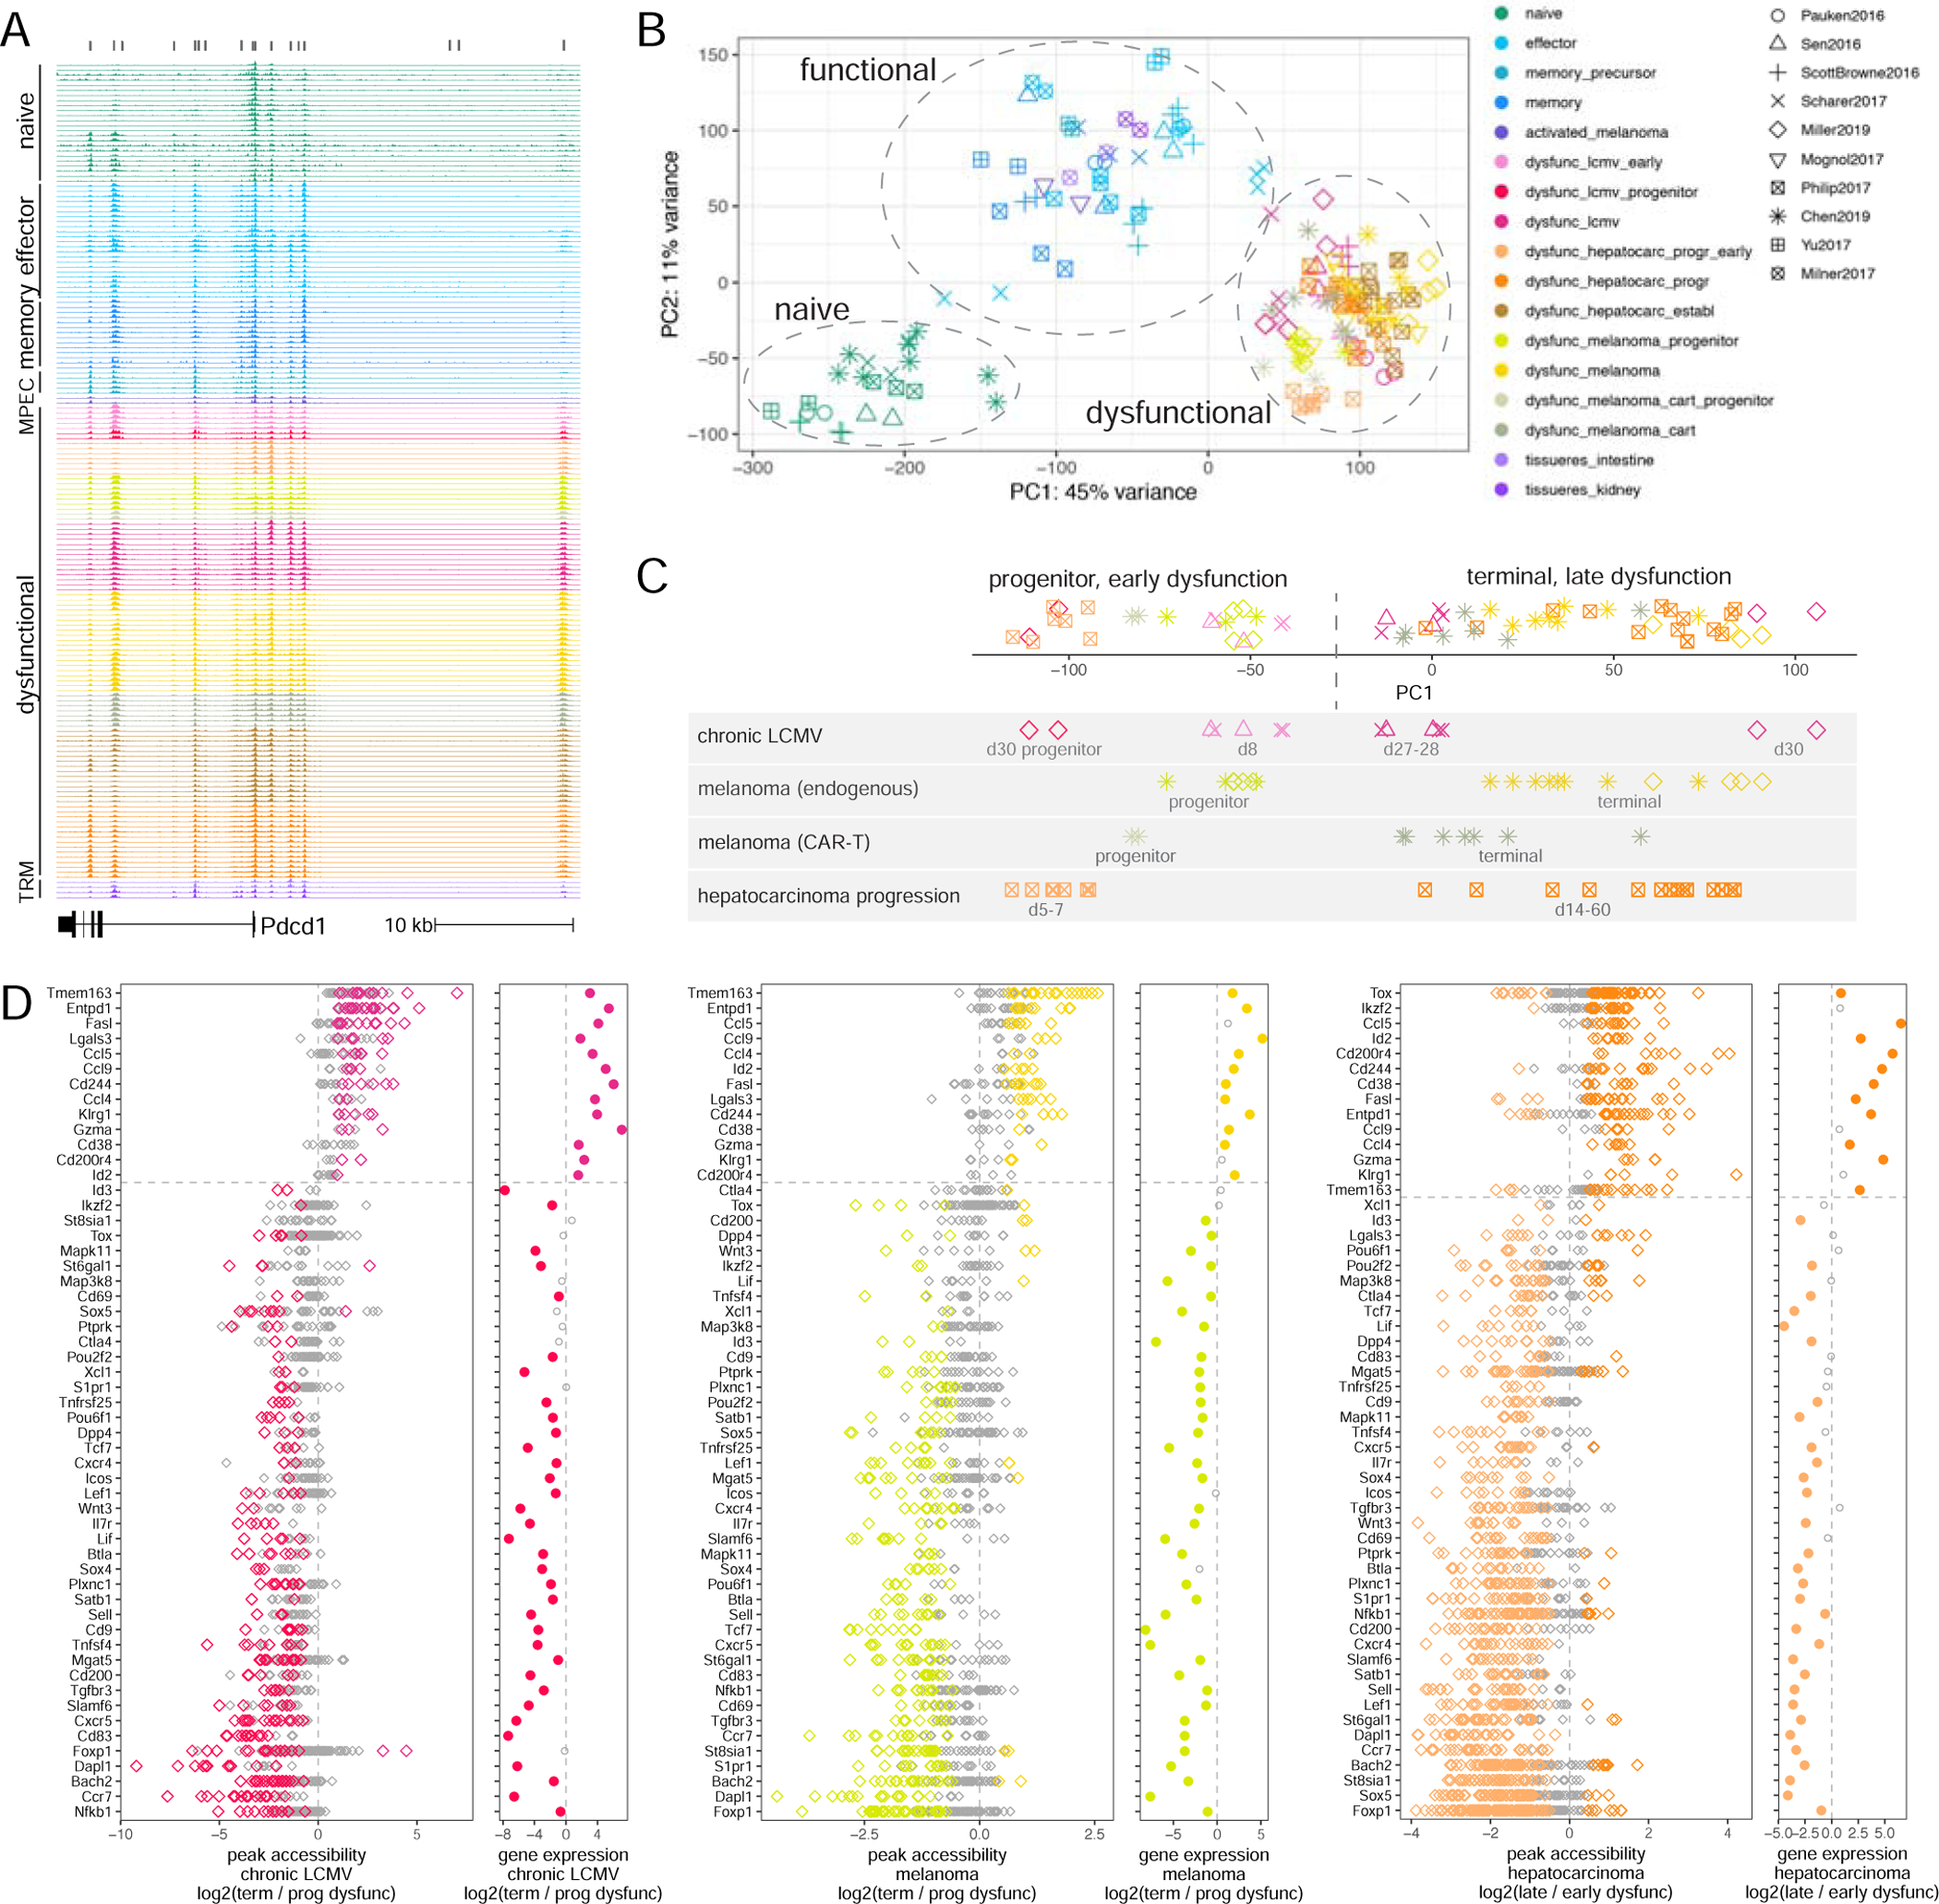
A. Snapshot of the ATAC-seq compendium near the Pdcd1 locus (light grey bars, peaks, dark grey bars, peak summit regions). B. PCA of batch-effect corrected ATAC-seq signal in peak summit regions (functional cell state, color; data source, shape). C. First principal component (PC1) of PCA for batch-effect corrected ATAC-seq signal in dysfunctional T cells from different studies (shown separately below) for peaks differentially accessible between progenitor and terminally dysfunctional cells in chronic LCMV infection. D. Differential accessibility and differential expression between progenitor and terminally dysfunctional T cells in chronic LCMV infection and in melanoma, and between early and late states of dysfunction in hepatocarcinoma progression. Left: batch-effect corrected ATAC-seq signal log2 fold change for peaks of significantly differentially accessible genes; right: log2 fold change of RNA-seq gene expression (color for significantly decreased/increased individual peaks or genes, FDR < 0.05). See also Figures S1, S2 and Tables S1-S3.