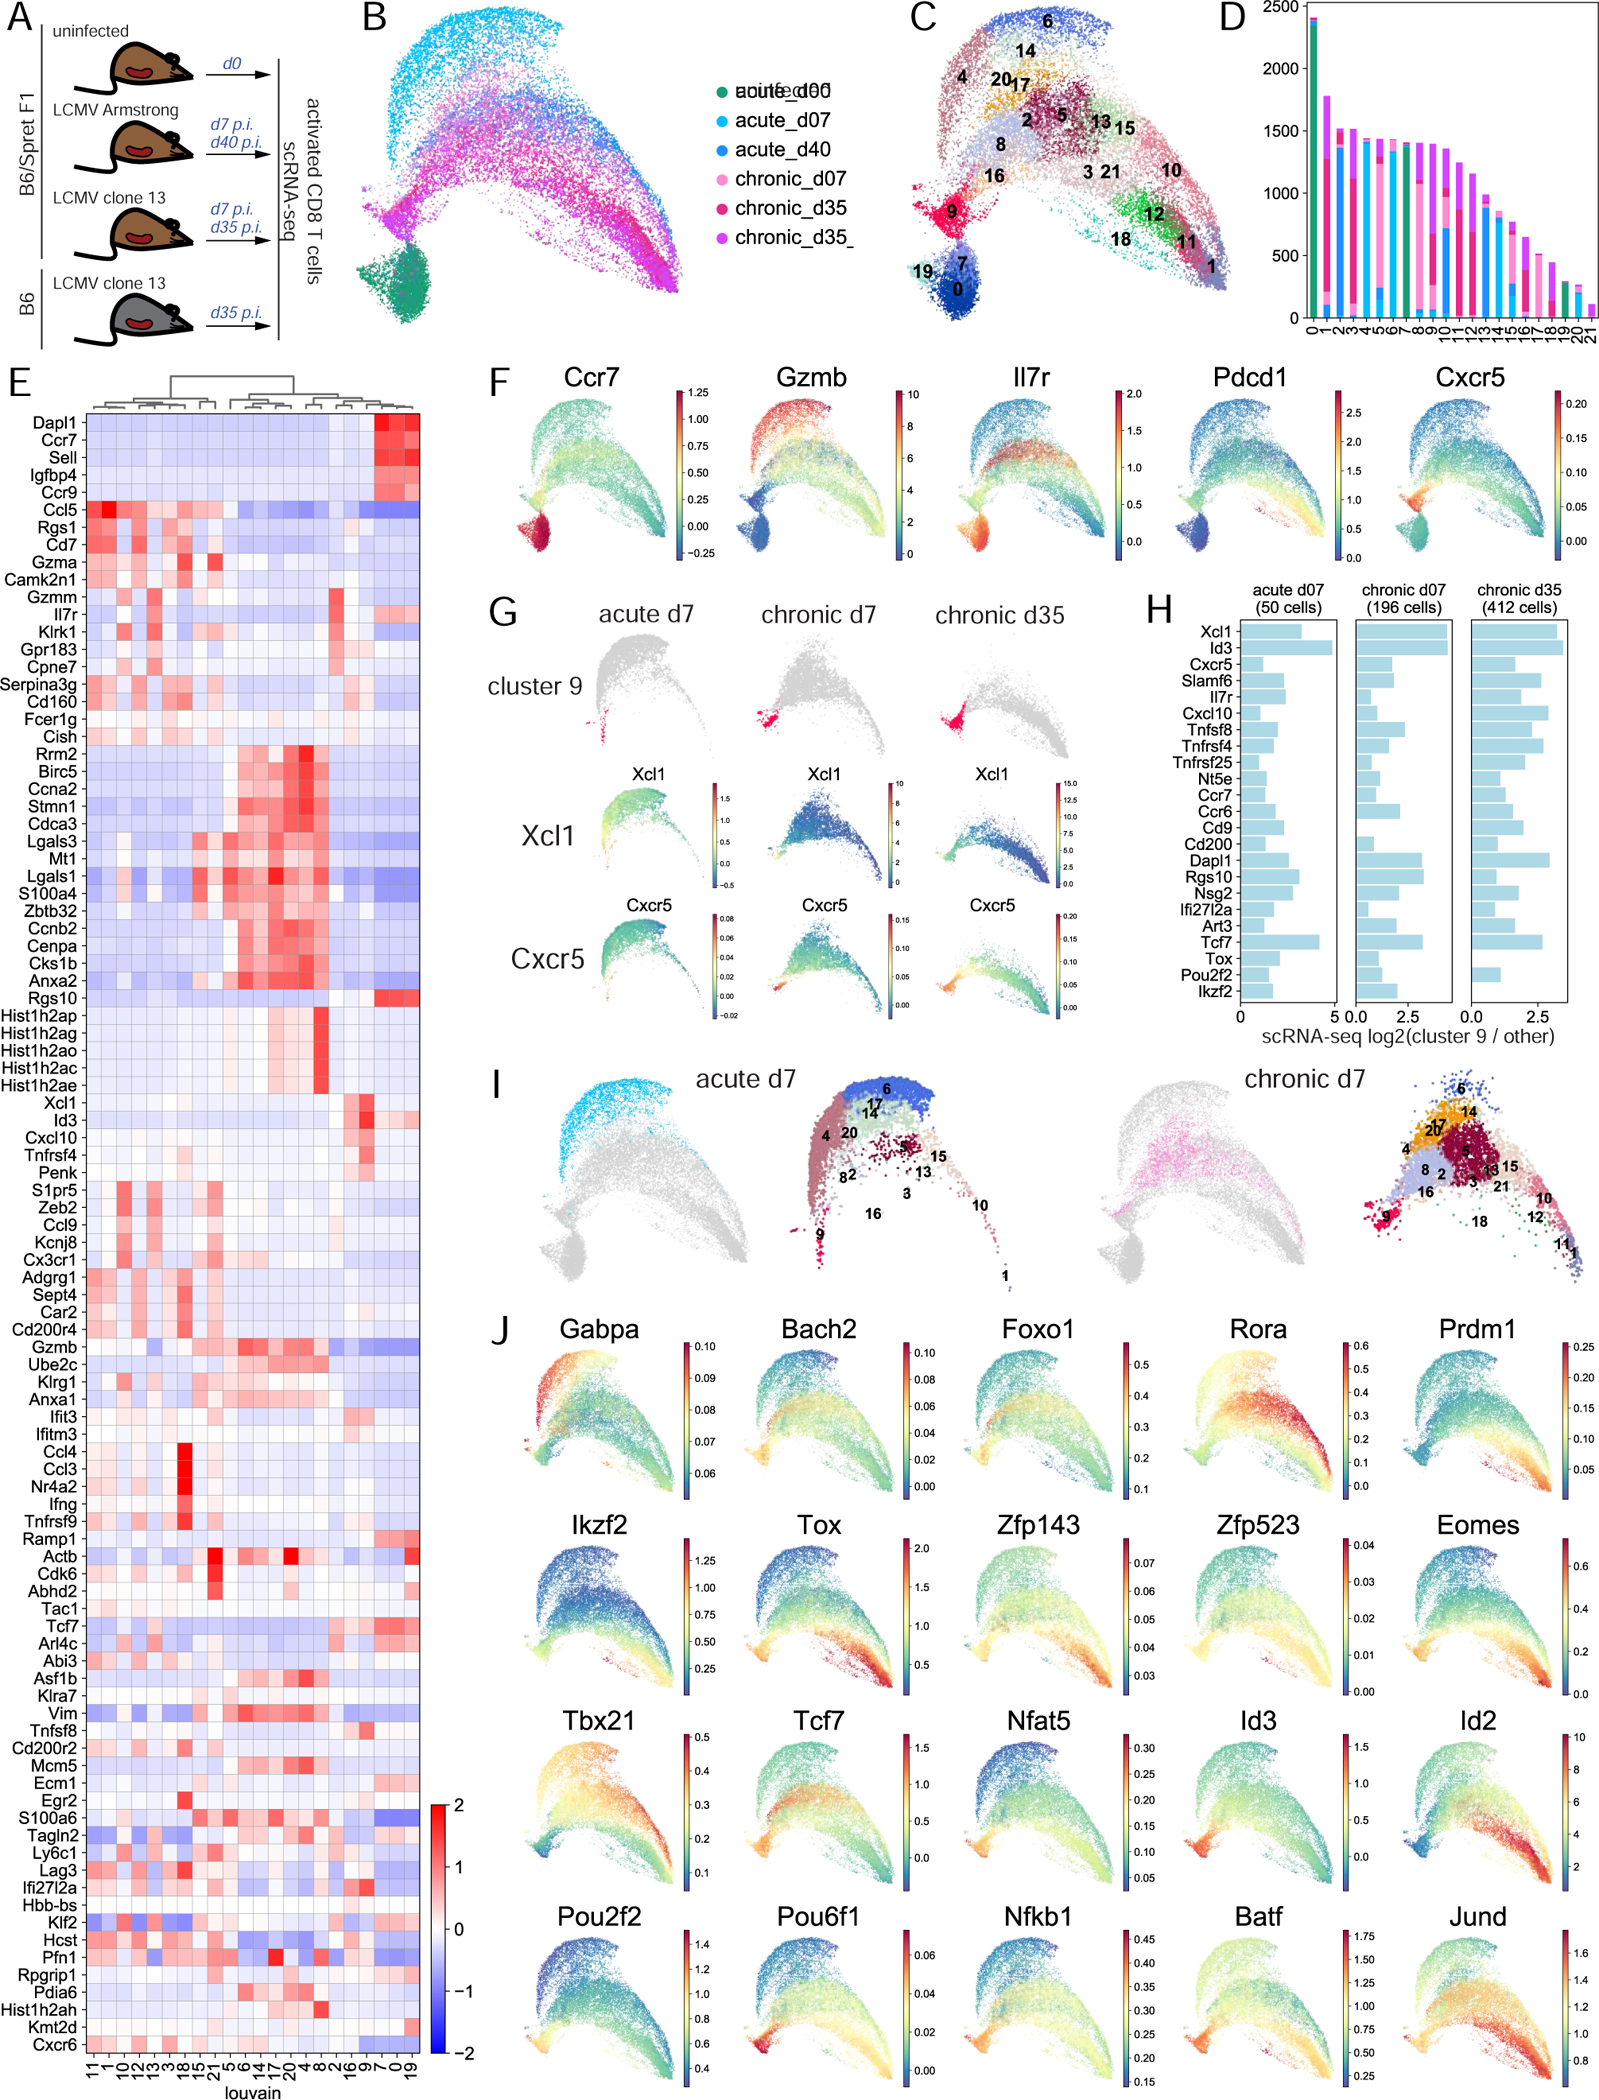
Figure 4. scRNA-seq analysis uncovers phenotypic heterogeneity of CD8 T cell response and cell-state specific transcription factor expression.

A. Experimental setup. B. UMAP of normalized scRNA-seq data. C. Louvain clustering of scRNA-seq data. D. Barplot of the number of cells in each cluster from each sample. E. Cluster-aggregated scRNA-seq gene expression in each cluster for differentially expressed genes between clusters (z-score row normalized). F. MAGIC-imputed gene expression for selected genes. G. MAGIC-imputed gene expression in individual samples. H. Log2 fold change of expression in individual samples of selected genes in cluster 9 cells vs. all other cells. I. Cells at d7 in acute and chronic infection separately and their cluster composition, within overall UMAP. J. MAGIC-imputed expression of selected genes encoding TFs. See also Figures S6-S11 and Table S5.
