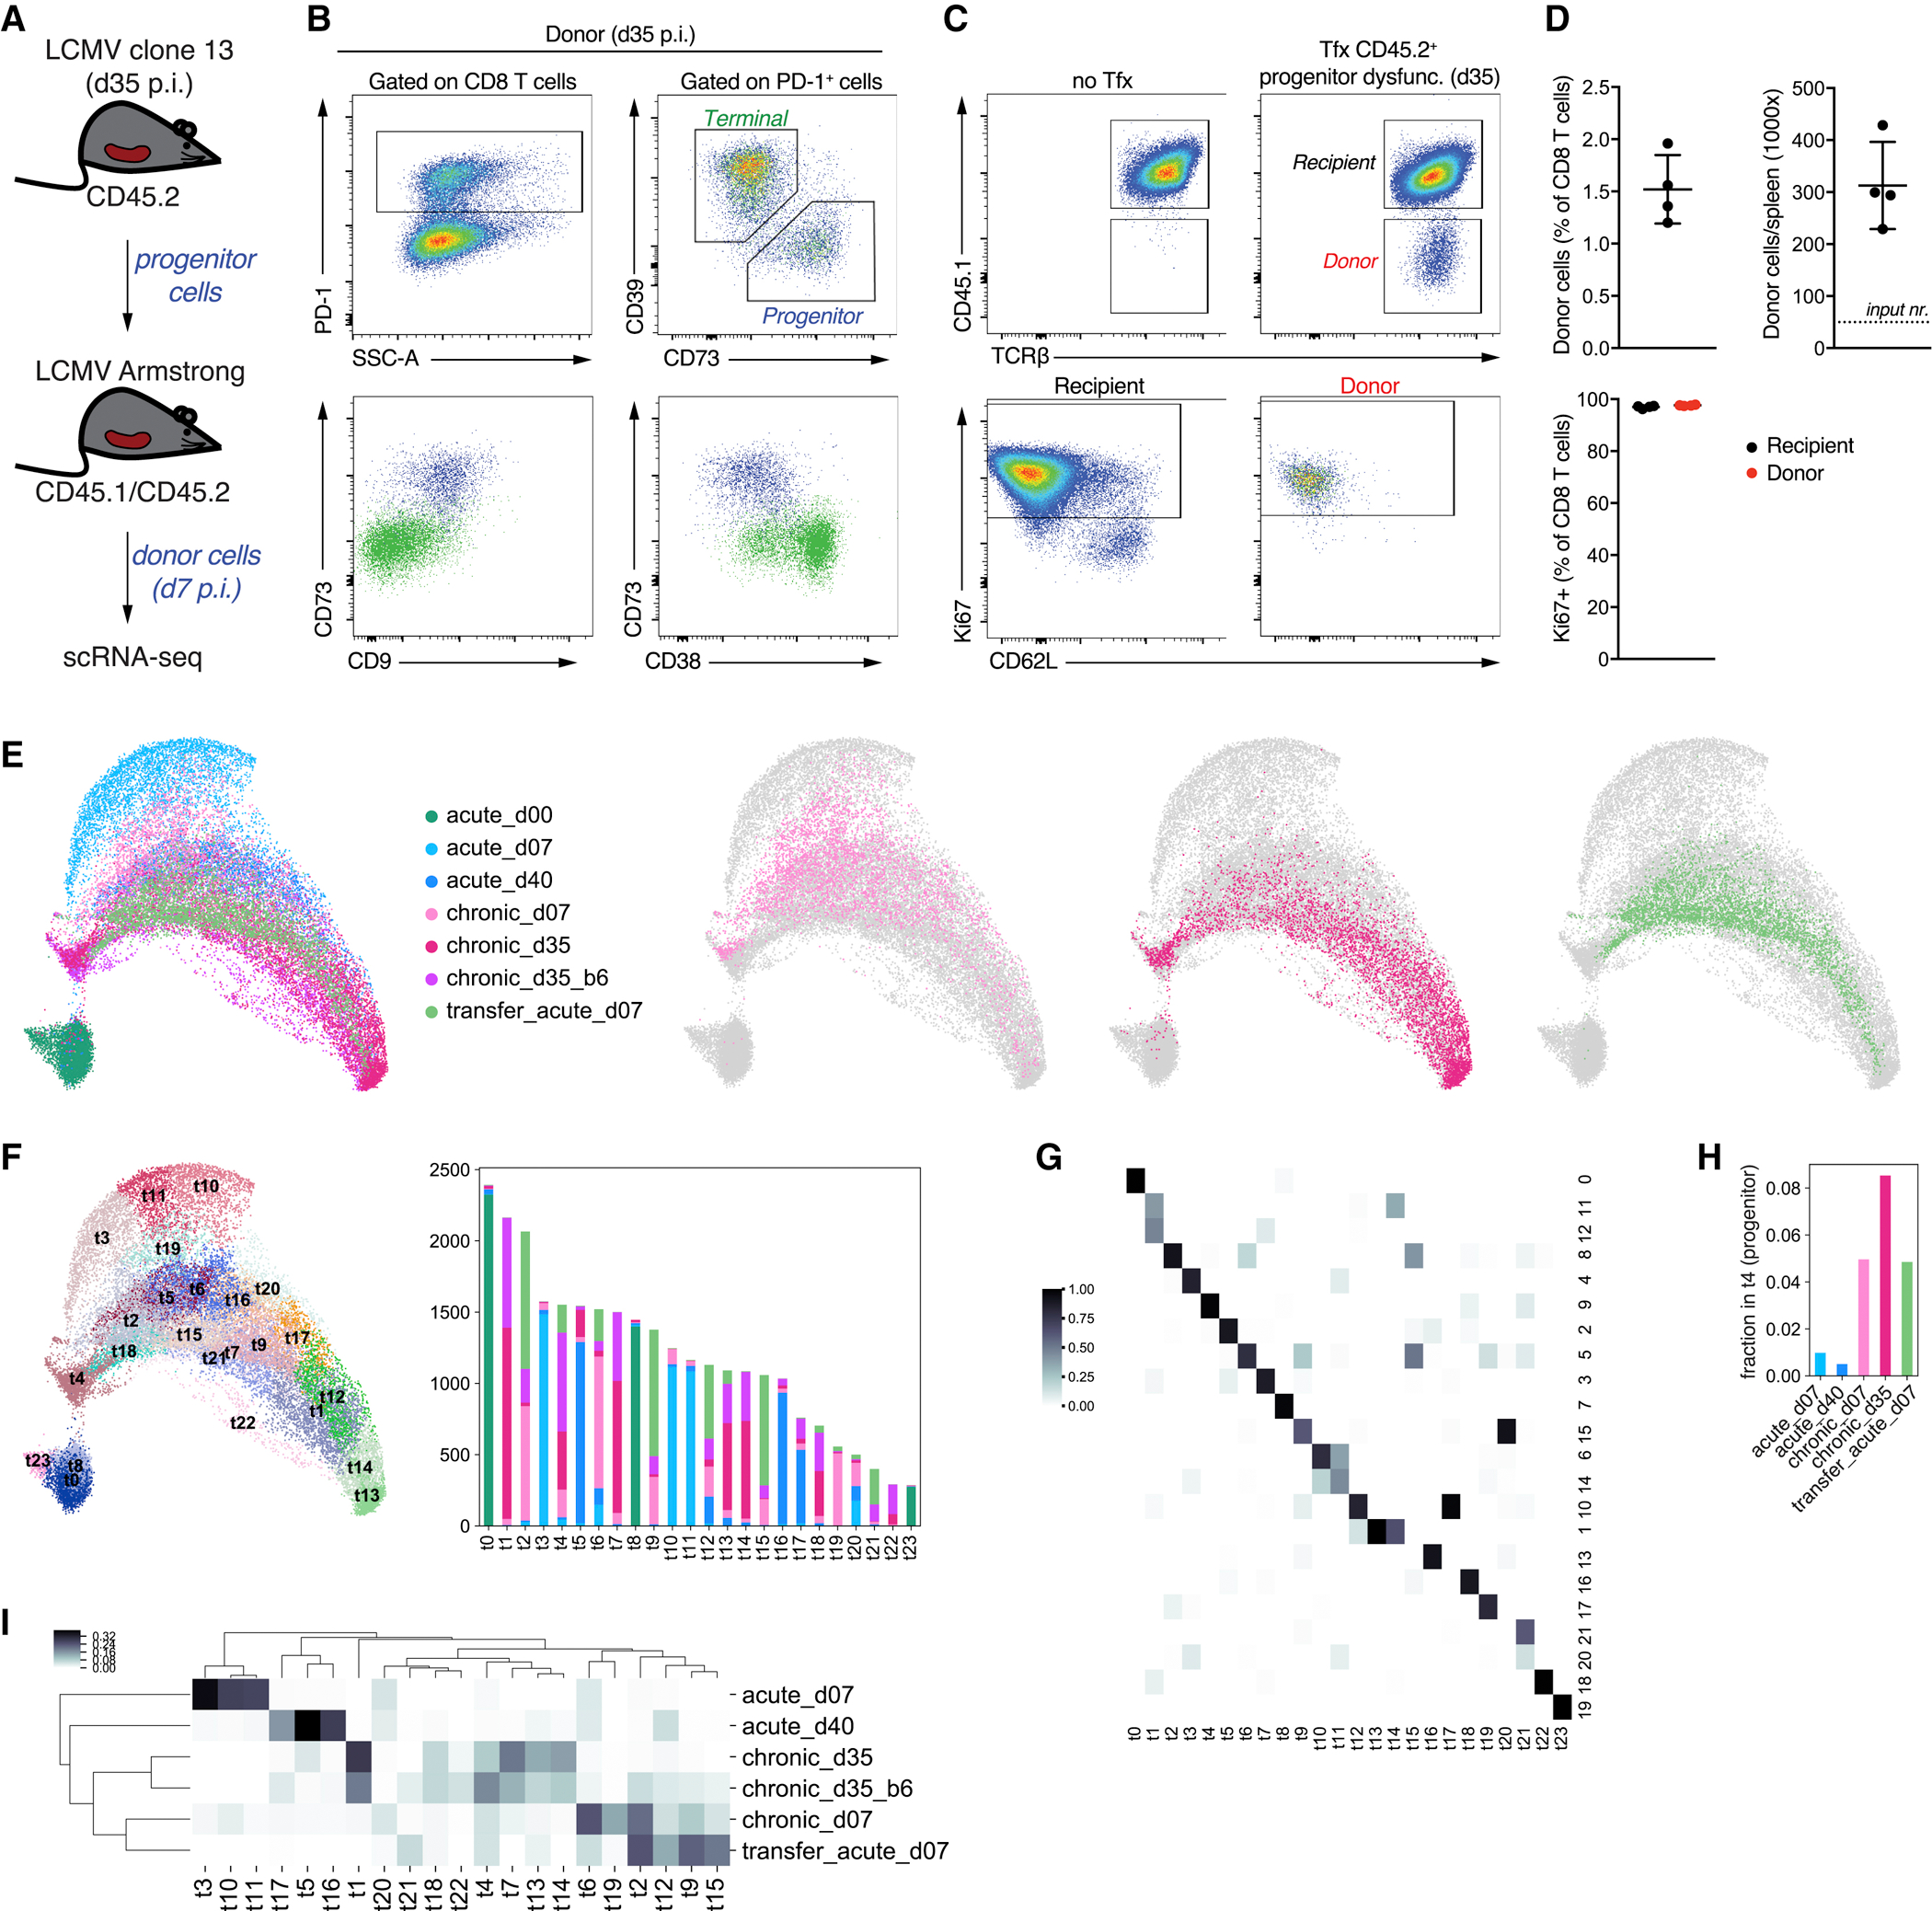
Figure 6. Progenitor CD8 T cells from chronic infection transferred to acute infection are committed to dysfunction.

A. Setup for the adoptive cell transfer experiment. B-C. Flow cytometry of selected genes for progenitor cells before transfer (B) and after transfer and expansion (C) in acute infection. D. Quantification of flow cytometry results for donor cells after transfer and expansion. E. Left: UMAP of all scRNA-seq data including the expanded donor cells; right: UMAP showing individual samples within the overall map. F. New Louvain clustering of all scRNA-seq data, with the barplot showing the number of cells in each cluster from each sample. G. Comparison of new clustering with the previous one (Figure 4C). Shown is a fraction of cells in clusters t0–t23 that belong to previously obtained clusters 0–21. H. Fraction of cells in each sample that belong to the progenitor cluster t4. I. Cluster composition of samples. Heatmap showing for each cluster what fraction of cells (excluding naïve) that cluster occupies in each sample. See also Table S5.
