. 2021 Sep 21;129(9):097010. doi: 10.1289/EHP8459

Figure 4.

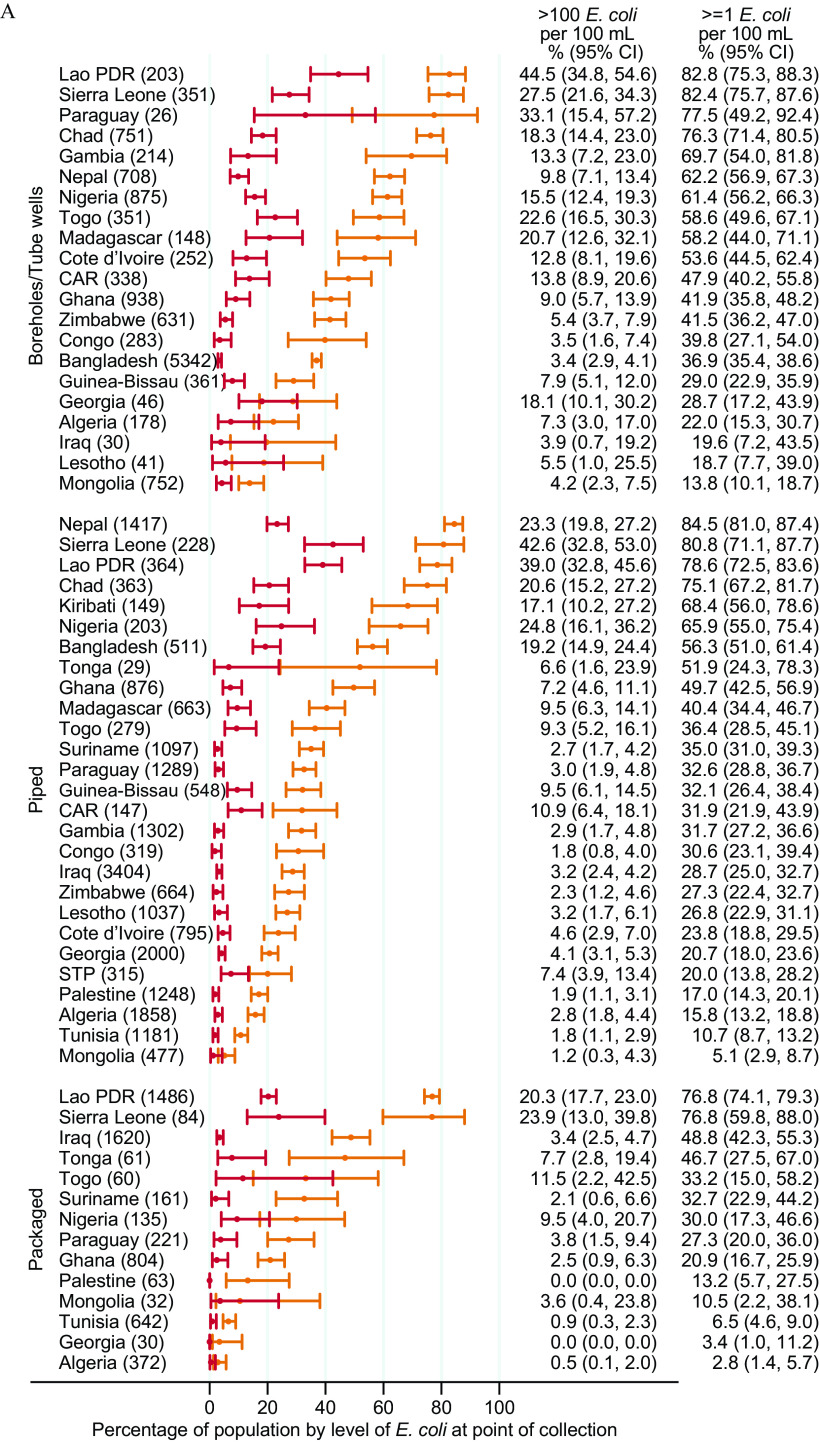
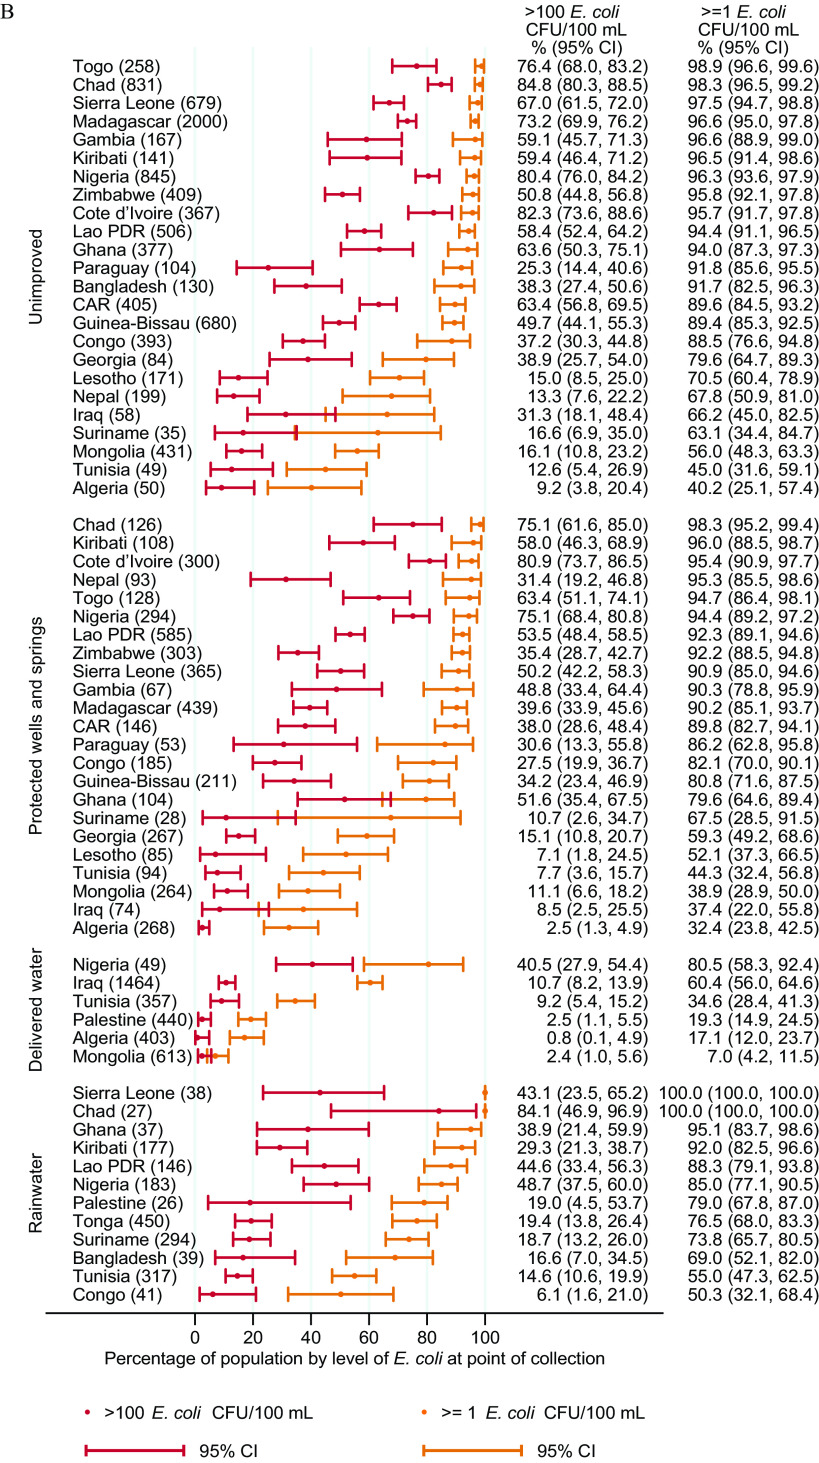
Figure 4A is an error bar graph, plotting (from bottom to top) Packaged, including Algeria (372). Georgia (30), Tunisia (642), Mongolia (32), Palestine (63), Ghana (804), Paraguay (221), Nigeria (135), Suriname (161), Togo (60), Tonga (61), Iraq (1,620), Sierra Leone (84), Lao People’s Democratic Republic (1,486); Piped, including Mongolia (477), Tunisia (1,181), Algeria (1,858), Palestine (1,248), Sao Tome and Principe (315), Georgia (2,000), Cote d’Ivoire (795), Lesotho (1,037), Zimbabwe (664), Iraq (3,404), Congo (319), Gambia (1,302), Central African Republic (147), Guinea-Bissau (548), Paraguay (1,289), Suriname (1,097), Togo (279), Madagascar (663), Ghana (876), Tonga (29), Bangladesh (511), Nigeria (203), Kiribati (149), Chad (363), Lao People’s Democratic Republic (364), Sierra Leone (228), and Nepal (1,417); and Boreholes or Tube wells, including Mongolia (752), Lesotho (41), Iraq (30), Algeria (178), Georgia (46), Guinea-Bissau (361), Bangladesh (5,342), Congo (283), Zimbabwe (631), Ghana (938), Central African Republic (338), Cote d’Ivoire (252), Madagascar (148), Togo (351), Nigeria (875), Nepal (708), Gambia (214), Chad (751), Paraguay (26), Sierra Leone (351), and Lao People’s Democratic Republic (203) (y-axis) across Percentage of population by level of Escherichia coli at point of collection, ranging from 0 to 100 in increments of 20 (x-axis) for greater than 100 Escherichia coli CFUs per 100 milliliter, percentage (95 percent Confidence Intervals) and greater than or equal to 1 Escherichia coli CFUs per 100 milliliter, percentage (95 percent Confidence Intervals). Figure 4B is an error bar graph, plotting (from bottom to top) Rainwater, including Congo (41), Tunisia (317), Bangladesh (39), Suriname (294), Tonga (450), Palestine (26), Nigeria (183), Lao People’s Democratic Republic (146), Kiribati (177), Ghana (37), Chad (27), Sierra Leone (38); Delivered water, including Mongolia (613), Algeria (403), Palestine (440), Tunisia (357), Iraq (1,464), and Nigeria (49); Protected wells and springs, including Algeria (268), Iraq (74), Mongolia (264), Tunisia (94), Lesotho (85), Georgia (267), Suriname (28), Ghana (104), Guinea-Bissau (211), Congo (185), Paraguay (53), Central African Republic (146), Madagascar (439), Gambia (67), Sierra Leone (365), Zimbabwe (303), Lao People’s Democratic Republic (585), Nigeria (294), Togo (128), Nepal (93), Cote d’Ivoire (300), Kiribati (108), and Chad (126); and Unimproved, including Algeria (50), Tunisia (49), Mongolia (431), Suriname (35), Iraq (58), Nepal (199), Lesotho (171), Georgia (84), Congo (393), Guinea-Bissau (680), Central African Republic (405), Bangladesh (130), Paraguay (104), Ghana (377), Lao People’s Democratic Republic (506), Cote d’Ivoire (367), Zimbabwe (409), Nigeria (845), Kiribati (141), Gambia (167), Madagascar (2,000), Sierra Leone (679), Chad (831), and Togo (258 (y-axis) across Percentage of population by level of Escherichia coli at point of collection, ranging from 0 to 100 in increments of 20 (x-axis) for greater than 100 Escherichia coli CFUs per 100 milliliter, percentage (95 percent Confidence Intervals) and greater than or equal to 1 Escherichia coli CFUs per 100 milliliter, percentage (95 percent Confidence Intervals).

Figure 4A is an error bar graph, plotting (from bottom to top) Packaged, including Algeria (372). Georgia (30), Tunisia (642), Mongolia (32), Palestine (63), Ghana (804), Paraguay (221), Nigeria (135), Suriname (161), Togo (60), Tonga (61), Iraq (1,620), Sierra Leone (84), Lao People’s Democratic Republic (1,486); Piped, including Mongolia (477), Tunisia (1,181), Algeria (1,858), Palestine (1,248), Sao Tome and Principe (315), Georgia (2,000), Cote d’Ivoire (795), Lesotho (1,037), Zimbabwe (664), Iraq (3,404), Congo (319), Gambia (1,302), Central African Republic (147), Guinea-Bissau (548), Paraguay (1,289), Suriname (1,097), Togo (279), Madagascar (663), Ghana (876), Tonga (29), Bangladesh (511), Nigeria (203), Kiribati (149), Chad (363), Lao People’s Democratic Republic (364), Sierra Leone (228), and Nepal (1,417); and Boreholes or Tube wells, including Mongolia (752), Lesotho (41), Iraq (30), Algeria (178), Georgia (46), Guinea-Bissau (361), Bangladesh (5,342), Congo (283), Zimbabwe (631), Ghana (938), Central African Republic (338), Cote d’Ivoire (252), Madagascar (148), Togo (351), Nigeria (875), Nepal (708), Gambia (214), Chad (751), Paraguay (26), Sierra Leone (351), and Lao People’s Democratic Republic (203) (y-axis) across Percentage of population by level of Escherichia coli at point of collection, ranging from 0 to 100 in increments of 20 (x-axis) for greater than 100 Escherichia coli CFUs per 100 milliliter, percentage (95 percent Confidence Intervals) and greater than or equal to 1 Escherichia coli CFUs per 100 milliliter, percentage (95 percent Confidence Intervals). Figure 4B is an error bar graph, plotting (from bottom to top) Rainwater, including Congo (41), Tunisia (317), Bangladesh (39), Suriname (294), Tonga (450), Palestine (26), Nigeria (183), Lao People’s Democratic Republic (146), Kiribati (177), Ghana (37), Chad (27), Sierra Leone (38); Delivered water, including Mongolia (613), Algeria (403), Palestine (440), Tunisia (357), Iraq (1,464), and Nigeria (49); Protected wells and springs, including Algeria (268), Iraq (74), Mongolia (264), Tunisia (94), Lesotho (85), Georgia (267), Suriname (28), Ghana (104), Guinea-Bissau (211), Congo (185), Paraguay (53), Central African Republic (146), Madagascar (439), Gambia (67), Sierra Leone (365), Zimbabwe (303), Lao People’s Democratic Republic (585), Nigeria (294), Togo (128), Nepal (93), Cote d’Ivoire (300), Kiribati (108), and Chad (126); and Unimproved, including Algeria (50), Tunisia (49), Mongolia (431), Suriname (35), Iraq (58), Nepal (199), Lesotho (171), Georgia (84), Congo (393), Guinea-Bissau (680), Central African Republic (405), Bangladesh (130), Paraguay (104), Ghana (377), Lao People’s Democratic Republic (506), Cote d’Ivoire (367), Zimbabwe (409), Nigeria (845), Kiribati (141), Gambia (167), Madagascar (2,000), Sierra Leone (679), Chad (831), and Togo (258 (y-axis) across Percentage of population by level of Escherichia coli at point of collection, ranging from 0 to 100 in increments of 20 (x-axis) for greater than 100 Escherichia coli CFUs per 100 milliliter, percentage (95 percent Confidence Intervals) and greater than or equal to 1 Escherichia coli CFUs per 100 milliliter, percentage (95 percent Confidence Intervals).

E. coli contamination of drinking water at point of use, by type of water source in 27 low- and middle-income countries, 2014–2020 for source types with at least 25 samples: (A) packaged, piped, and boreholes/tube wells; and (B) rainwater, delivered water, protected wells and springs, and unimproved water sources. Numbers in parentheses are the unweighted number of water sources tested for E. coli at point of collection. Corresponding numeric data are provided in Excel Table S2. Note: CAR, Central African Republic; CFU, colony forming unit; E. coli, Escherichia coli; Lao PDR, Lao People’s Democratic Republic; STP, Sao Tome and Principe.