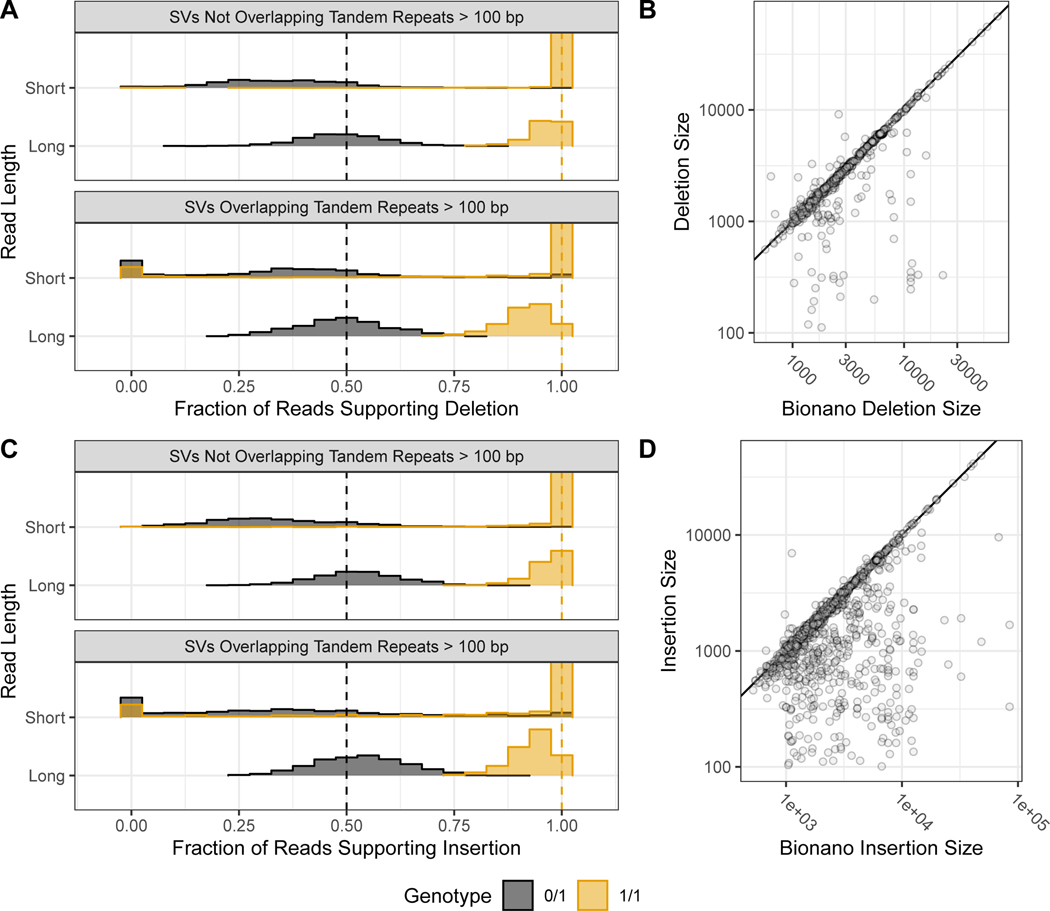
Figure 4: Support for benchmark SVs by long reads, short reads, and optical mapping.
Histograms show the fraction of PacBio (long-reads) and Illumina 150 bp (short-reads) reads that aligned better to the SV allele than to the reference allele using svviz, colored by v0.6 genotype, where blue is heterozygous and orange is homozygous. Variants are stratified into deletions (A) & and insertions (C), and into SVs overlapping and not overlapping tandem repeats longer than 100bp in the reference. Vertical dashed lines correspond to the expected fractions 0.5 for heterozygous (blue) and 1.0 for homozygous variants (dark orange). The v0.6 benchmark set sequence-revolved deletion (B) and insertion (D) SV size is plotted against the size estimated by BioNano in any overlapping intervals, where points below the diagonal (indicated by the black line) represent smaller sequence-resolved SVs in the overlapping interval.

