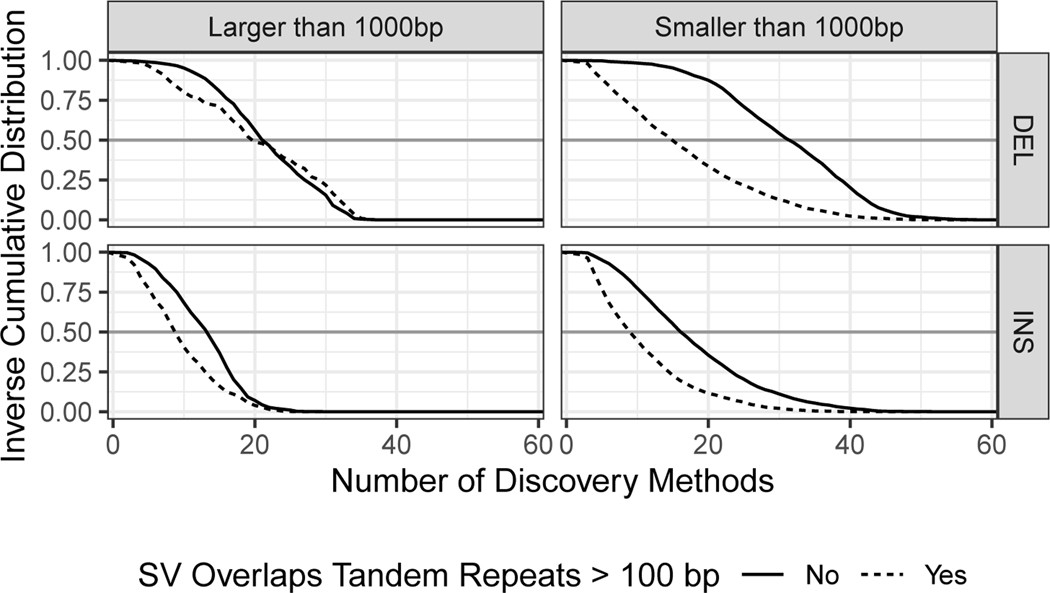
Figure 6: Inverse cumulative distribution showing the number of discovery methods that supported each SV.
All 68 callsets from all variant calling methods and technologies in all three members of the trio are included in these distributions. SVs larger than 1000 bp (top) are displayed separately from SVs smaller than 1000 bp (bottom). Results are stratified into deletions (left) and insertions (right), and into SVs overlapping (black) and not overlapping (gold) tandem repeats longer than 100 bp in the reference. Grey horizontal line at 0.5 added to aid comparison between panels.

