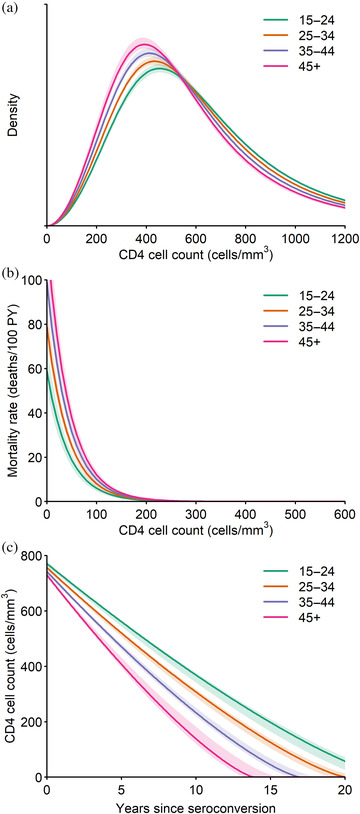
Figure 2.

Fitted natural history parameter estimates by age. Panels show (a) initial CD4 cell count distributions, (b) HIV‐related mortality rates by CD4 cell count and (c) CD4 cell count trends. Posterior point estimates (solid curves) and 95% credible intervals (shaded regions) are shown.
