
Figure 3.
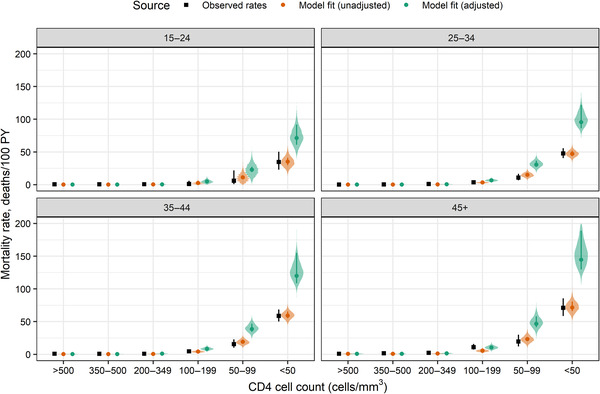
Model fit to all‐cause mortality data from the CASCADE Collaboration reported by Dunn et al. [28]. Unadjusted mortality rates used and were intended to fit observed rates closely. Adjusted rates used estimated values of that may account for mortality underestimation in the observed rates. Points show crude observed rates and model point estimates; whiskers show 95% exact Poisson confidence intervals on observed rates and 95% credible intervals on model estimates. Shaded regions show posterior predictive distributions on model estimates. Abbreviation: PY, person‐years.