
Fig. 1. Overview of HT-MEK and PafA.
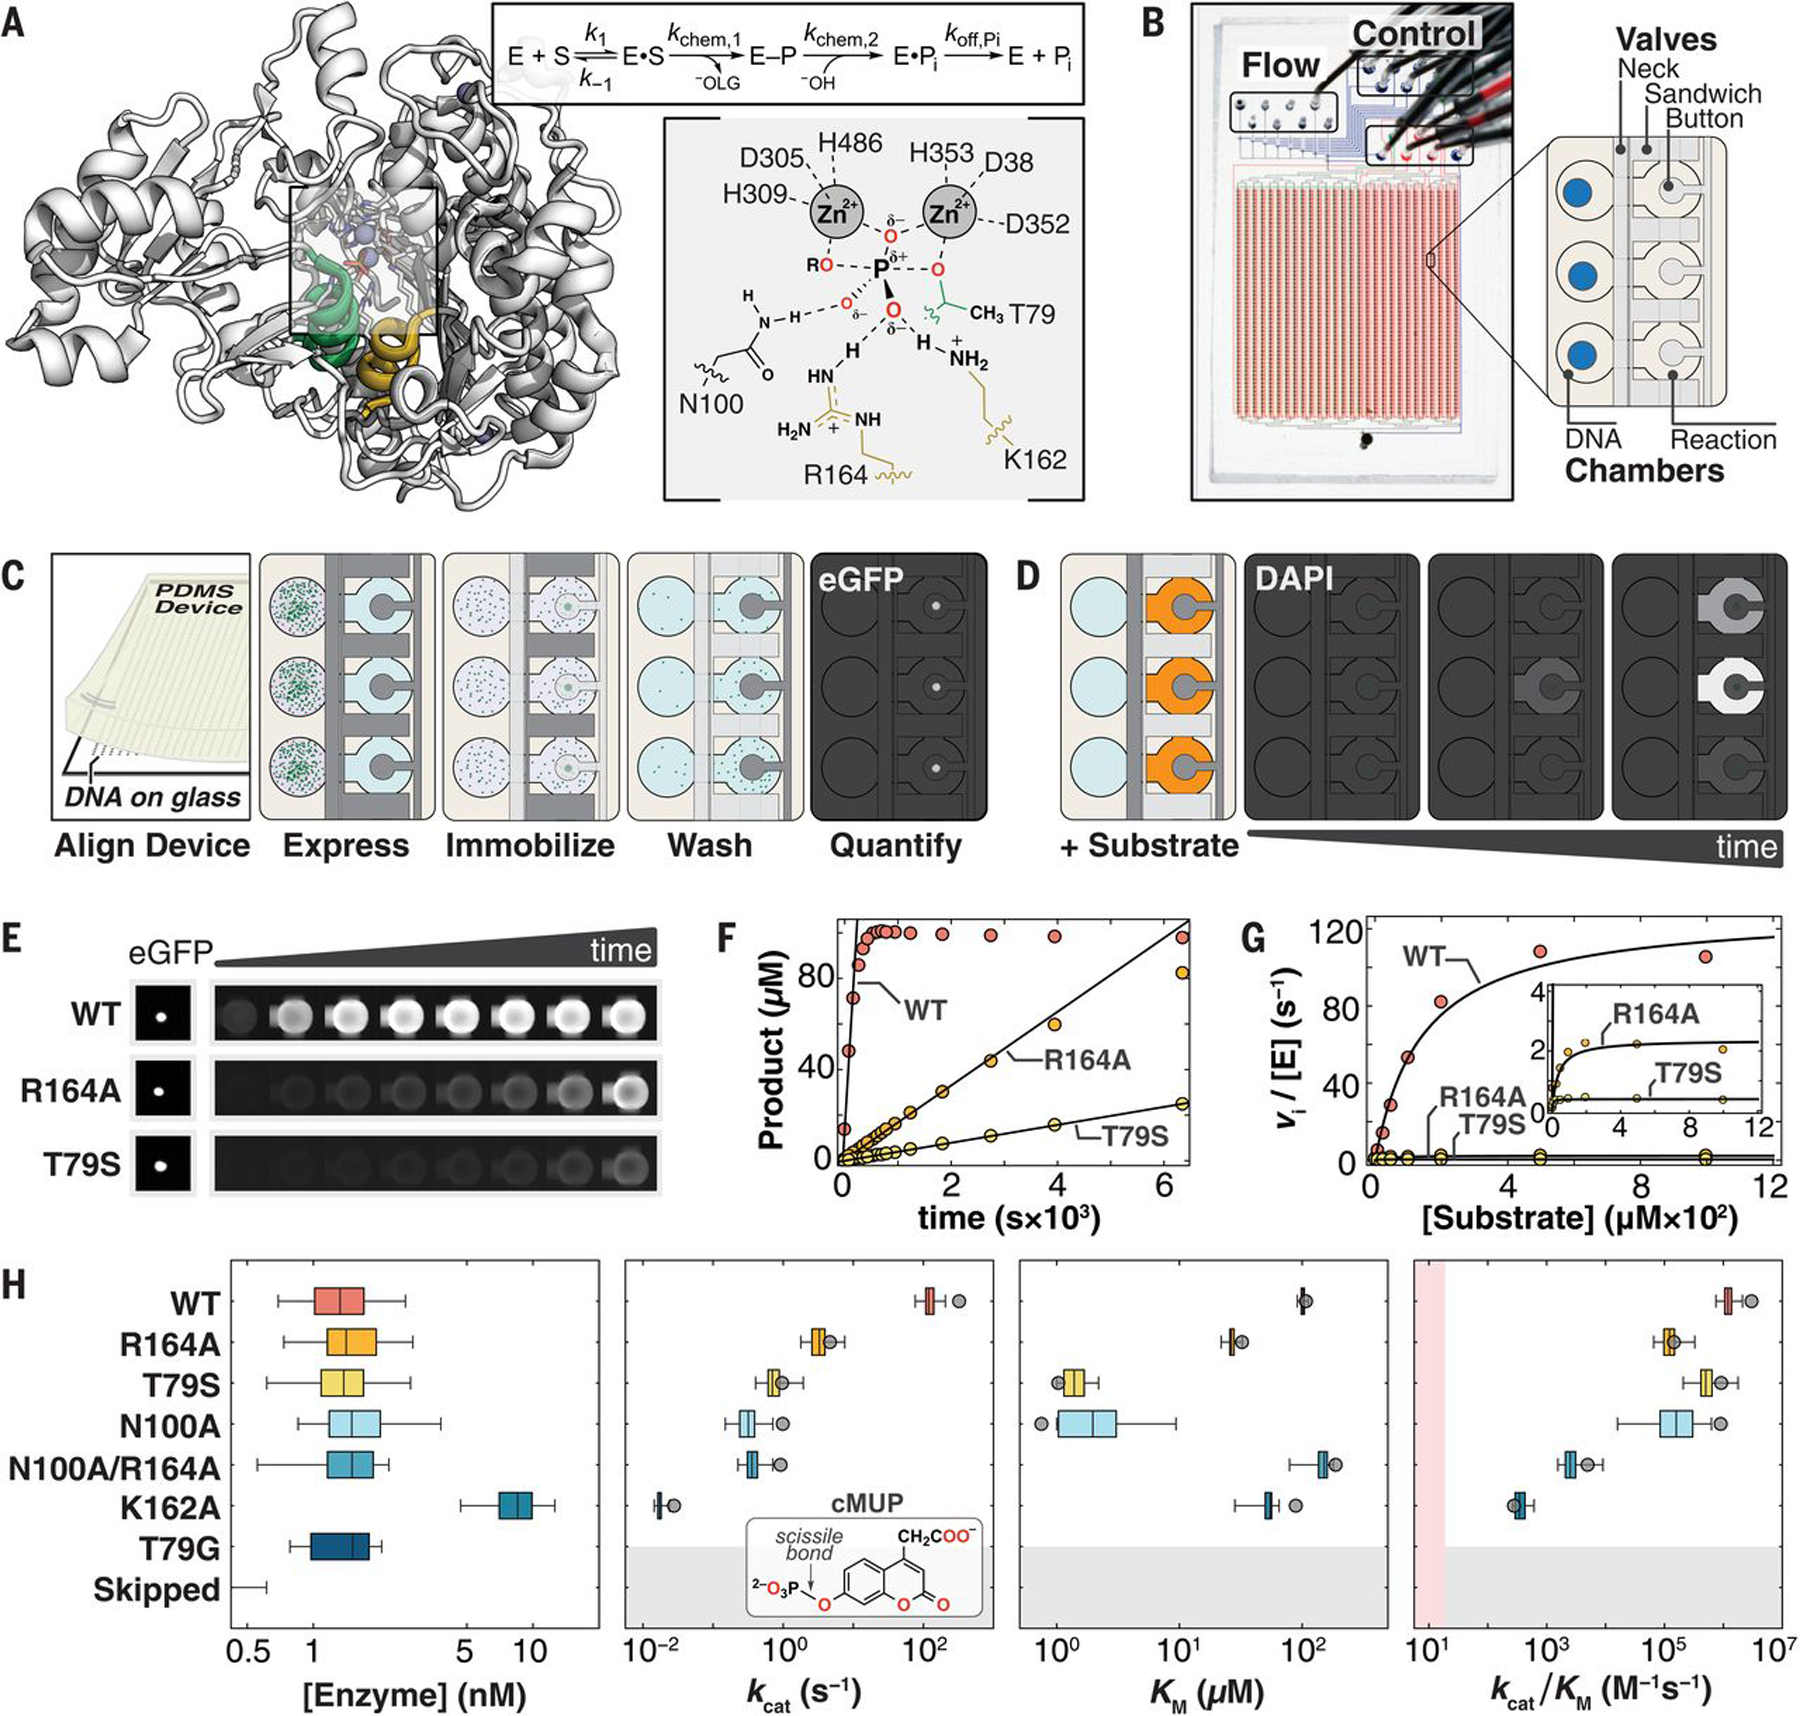
(A) (Left) Crystal structure of WT PafA [Protein Data Bank (PDB) ID: 5TJ3] highlighting “nucleophile” (residues 77 to 89, green) and “monoesterase” (residues 161 to 171, yellow) helices. (Right) PafA catalytic cycle (S, phosphate monoester substrate; E–P, covalent phospho-threonine intermediate; −OLG, alkoxide leaving group) and active site in the transition state of monoester hydrolysis. (Single-letter abbreviations for the amino acid residues are as follows: A, Ala; C, Cys; D, Asp; E, Glu; F, Phe; G, Gly; H, His; I, Ile; K, Lys; L, Leu; M, Met; N, Asn; P, Pro; Q, Gln; R, Arg; S, Ser; T, Thr; V, Val; W, Trp; and Y, Tyr. In the mutants, other amino acids were substituted at certain locations; for example, T79S indicates that threonine at position 79 was replaced by serine.) (B) HT-MEK microfluidic device image and schematic showing solution (Flow) and pneumatic manifold (Control) input ports, device valves, and chambers. (C) Schematic of on-chip enzyme expression pipeline. Dark and light gray valves are pressurized (closed) and depressurized (open), respectively. (D) Schematic of on-chip activity assays by using fluorogenic substrate in reaction chambers (orange). (E) Sample images of (left) immobilized enzyme and (right) fluorogenic product over time for WT PafA and two active-site mutants (R164A and T79S) with the substrate cMUP. (F) Example cMUP progress curves for chambers containing wild type and two active-site mutants and initial rate fits to these data. (G) Michaelis-Menten fits to initial rates yield kcat, Km, and kcat/Km for cMUP. (H) (Left) On-chip expressed concentrations for WT PafA and six active-site mutants calculated by using eGFP calibration curves. (Middle left to right) Comparisons of on-chip (box plots) and off-chip (gray circle) values of kcat, Km, and kcat/Km values (log10 axis) for cMUP for seven PafA variants (table S1) and (inset) cMUP structure. K162A was expressed at higher concentration in a later experimental tier (with higher [E]); “skipped” refers to chambers without plasmid DNA; pink shaded region denotes 10-fold above the median apparent second-order rate constant for T79G control chambers (supplementary materials, materials and methods).