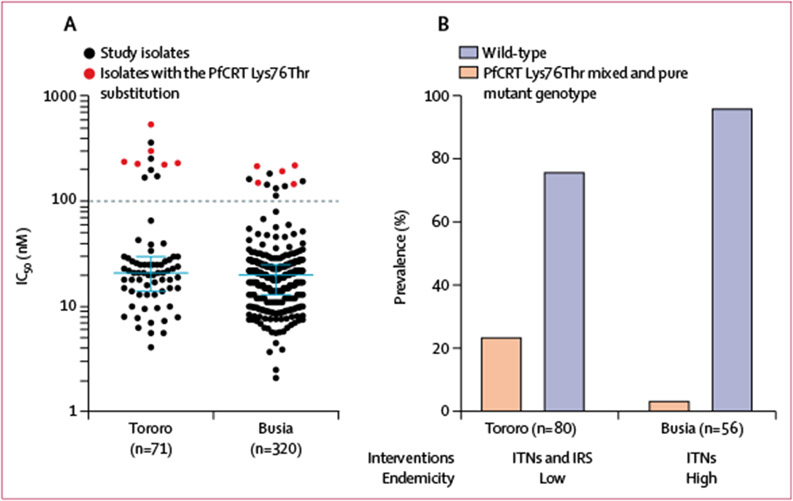
Figure 3: Chloroquine resistance in Plasmodium falciparum isolates in Tororo and Busia districts.
(A) Chloroquine susceptibility of isolates collected in 2016–19. Median IC50 values and IQR are shown by the blue bars and whiskers. Black dotted line shows a cutoff for chloroquine resistance (IC50 ≥100 nM). (B) Prevalence of isolates with the PfCRT Lys76Thr substitution (mixed and pure mutant genotypes) in 2018–19. IC50=half-maximal inhibitory concentrations. IRS=indoor residual spraying of insecticide. ITNs=insecticide-treated bednets. PfCRT=P falciparum chloroquine resistance transporter.

