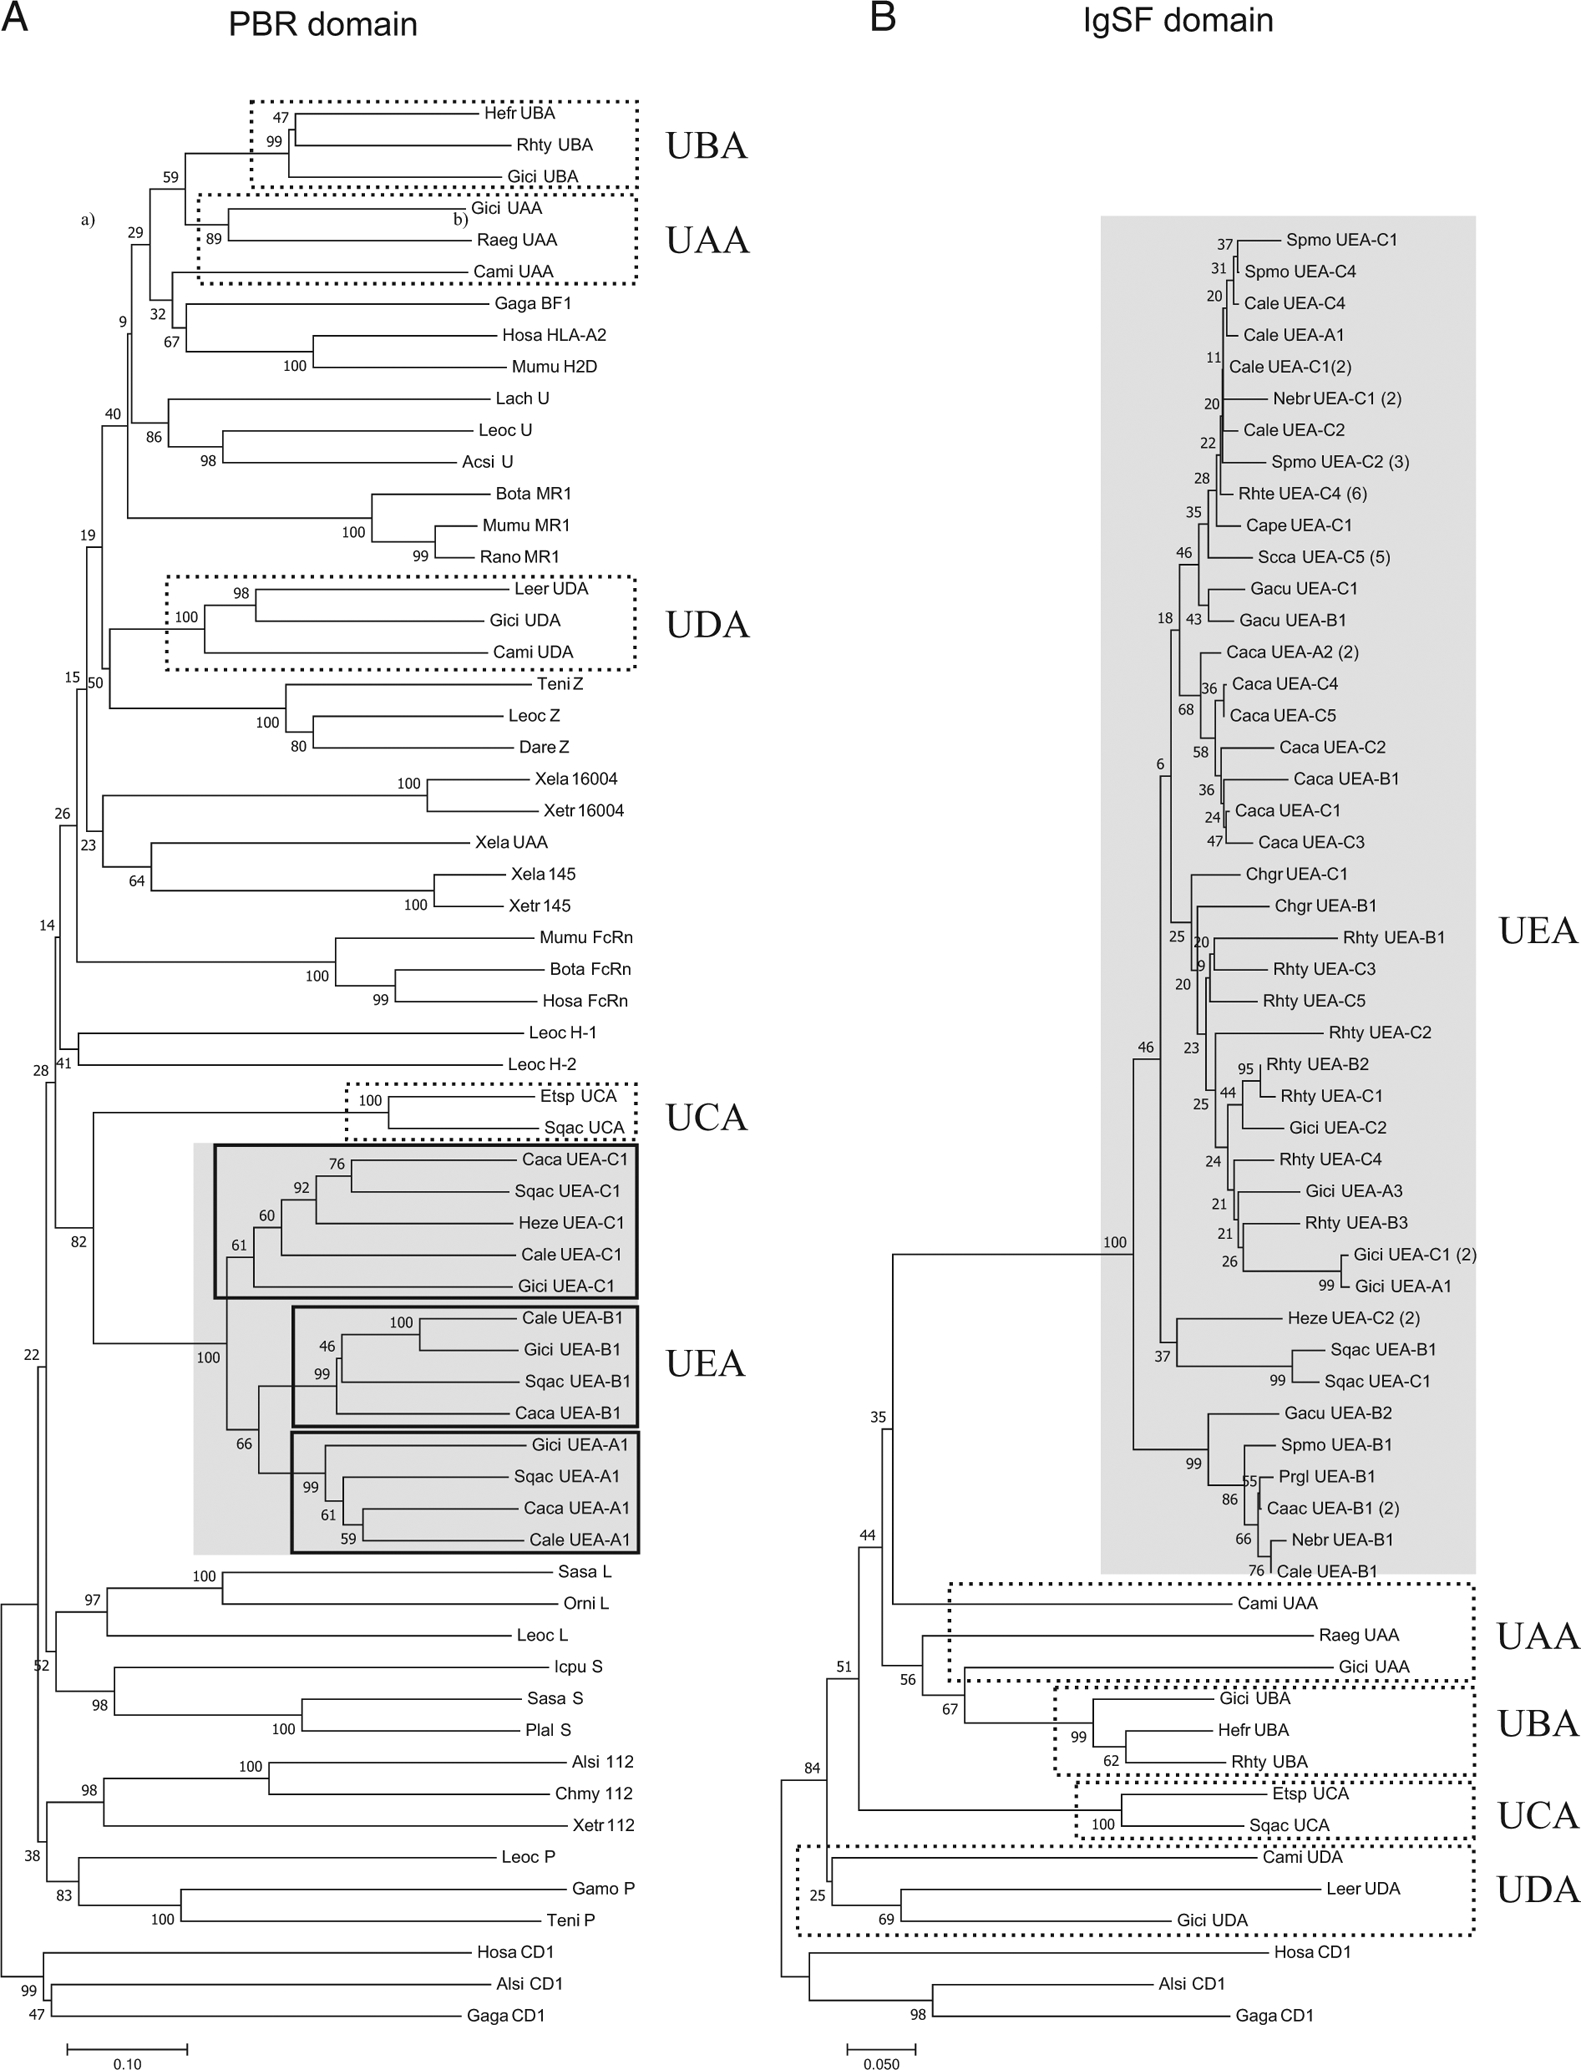
FIGURE 2.

(A) Phylogenetic tree of representative MHC class I lineages in cartilaginous fish and other selected vertebrate class I molecules with the α1 and α2 domains (PBR); (B) phylogenetic tree of cartilaginous fish class I lineages with the IgSF α3 domains. These trees were constructed using the NJ method and rooted with CD1. Bootstrap support values are shown as percentages on the branches. GenBank accession numbers for all the sequences are listed in Supplemental Table II, and the corresponding alignment is found in Supplemental Fig. 1. Common names are shown, followed by the abbreviation of the scientific name (two letters of the genus and two letters of species). The sublineages are represented by the letters A, B, and C, followed by the number corresponding to a specific sequence. The scale bar indicates the number of amino acid differences per sequence.
