Figure 6.
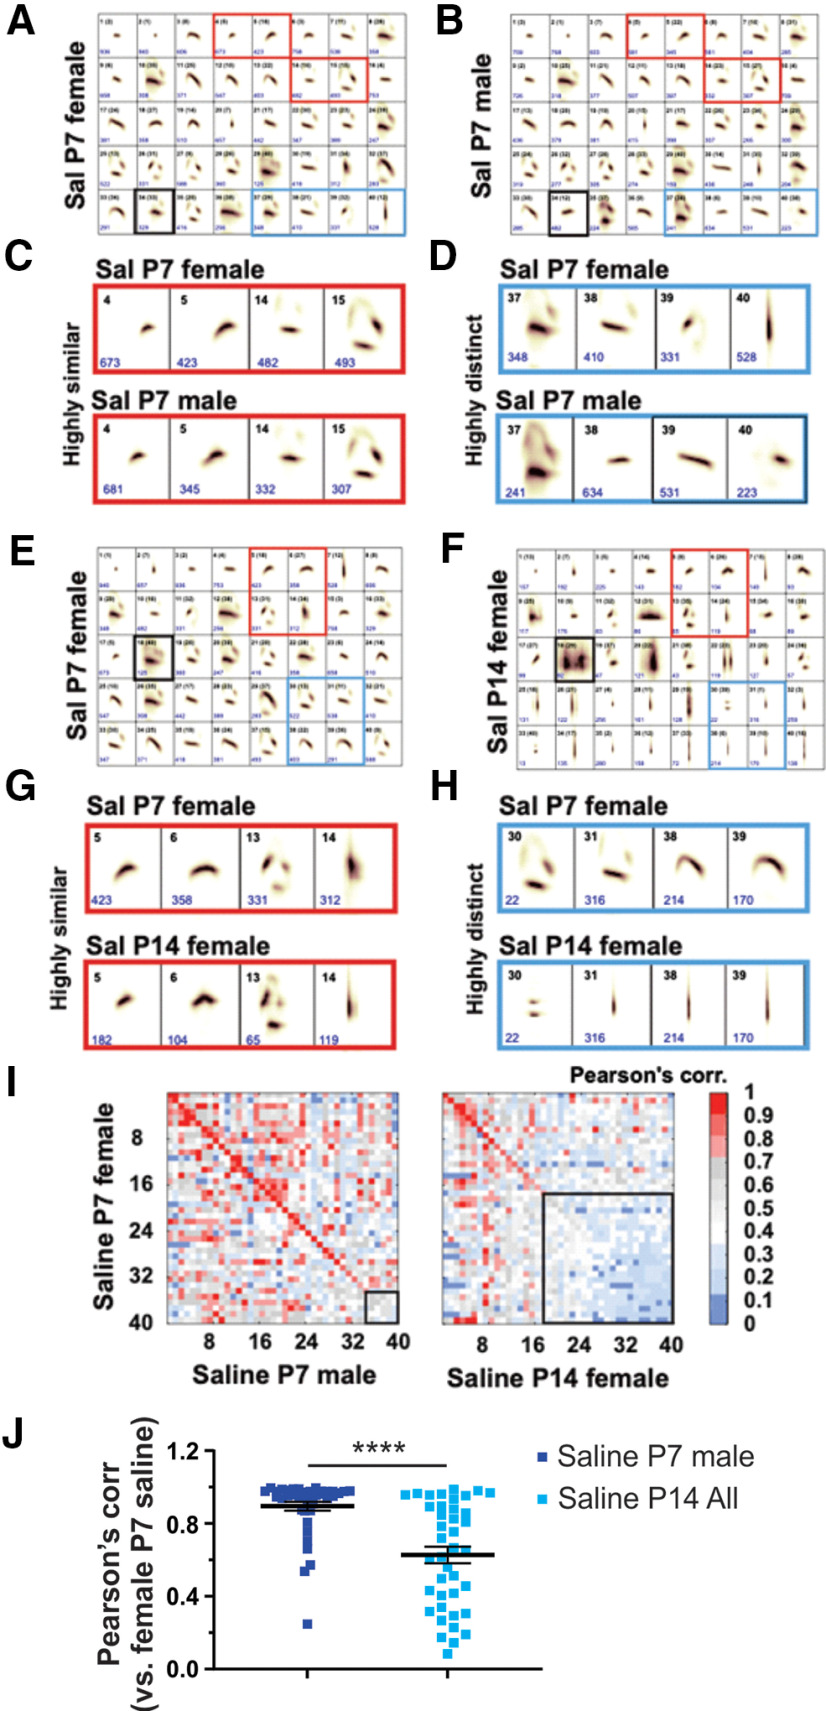
USV spectrotemporal structure is developmentally regulated from the first postnatal week (P7) to the second postnatal week (P14). A, B, Repertoires showing the 40 syllable types (average shape; top black numbers, syllable number) learned from processing recordings across the P7 saline datasets. Syllable types are listed in order of frequency of use from left to right (1–40), with the total number of syllables that are present in each syllable unit given in blue. Black number in parenthesis, original syllable number from datasets before performing comparison analysis. Red and blue squares are examples of highly similar or distinct syllables across groups, respectively. Pearson similarity scores are <0.70 after syllable labeled with bold black square. C, D, Examples of highly similar (A, B, red squares) and distinct syllables across saline P7 groups. E, F, Same as in A and B, but syllables learned from saline P7 and P14 datasets. D–G, Examples of highly similar (A, B, red squares) and distinct syllables across saline P7 groups. A–H, The lower side of each syllable frame is 150 ms. I, Similarity matrix of the spectral types of pairs of syllable units learned from comparisons between reference groups (saline P7 females) and saline P7 male mice (left panel) or saline P14 female mice (right panel). The matrix diagonal gives the Pearson correlation for sequential pairs of syllables from compared datasets ranked from most to least similar (e.g., syllable 1 in both repertories are highly similar). Bold black square in the similarity matrix indicates highly distinct syllable units (Pearson score, ≤0.70) and increases in saline P7/P14 comparison (left panel) relative to P7 comparisons (right panel), suggesting developmental regulation of USV spectrotemporal structure. I, J, Mean Pearson correlation values obtained from the diagonal in comparisons of saline P7 male (I, left) and P14 groups of both sexes (I, right; Fig. 7C) to saline P7 female mice, the “Reference Group.” Red and blue values, Pearson correlations for highly similar and distinct pairs of syllables, respectively. Saline P7 males versus saline P14 sex-combined (“All”). ****p < 0.0001, t test. Data are presented as the mean ± SEM.

