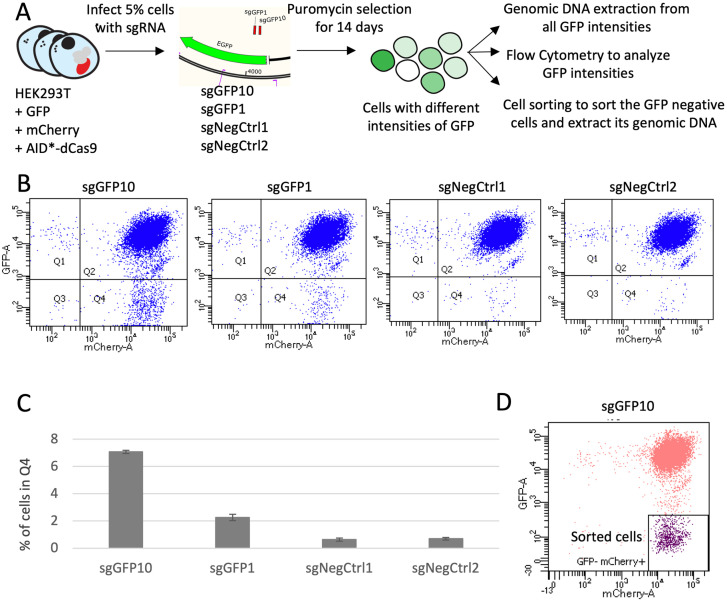
Fig 1. Testing modified CRISPR-X at low MOI targeting GFP.
A. Design of the experiment. B. Flow Cytometry analysis plotting GFP and mCherry fluorescent intensities. C. The percentages of cells in Q4 quadrant for Fig 1B are graphed. The mean of three independent replicates with the standard deviation is shown. D. Flow cytometry analysis of sample sgGFP10, with sorted GFP-negative cells colored in purple.

