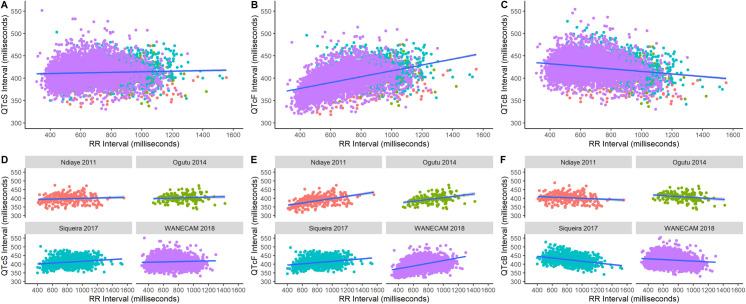
Fig 2. Corrected QT interval and RR interval relationships by correction method and individual study.
QT intervals adjusted with study-specific (, where βage decreased with increasing age), Fridericia (), and Bazett heart rate corrections () and their relationship with RR intervals in the pooled dataset (top panels) and by individual study (bottom panels) with means (blue line) and 95% CIs (shaded area) from linear regression. A slight positive relationship is expected even with ideal correction because of confounding by body temperature changes, i.e., fever and defervescence, in malaria.

