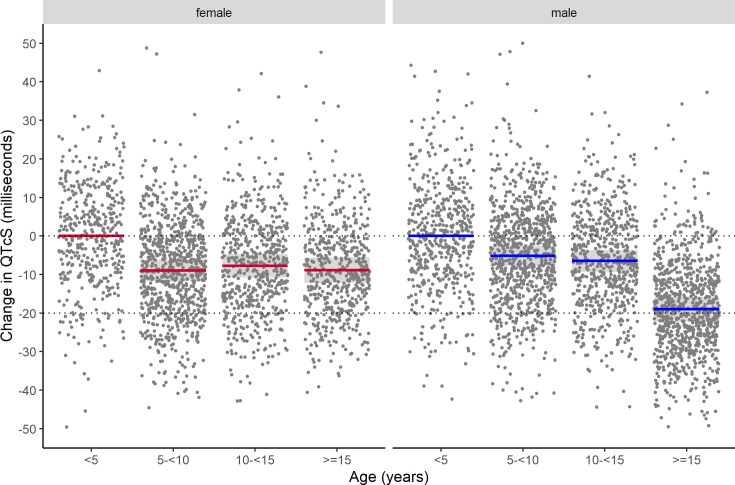
Fig 4. Differences in corrected QT interval by age group and sex.
Mean differences in QT interval adjusted with study-specific heart rate correction (QTcS) by age group and sex compared with the mean value for children aged <5 years from a multivariable linear mixed effects regression model adjusting for treatment day, antimalarial treatment arm, body temperature, and individual study/site/person effects. Lines indicate means with colour representing sex, shaded areas denote 95% confidence intervals, and dots are partial residuals.

