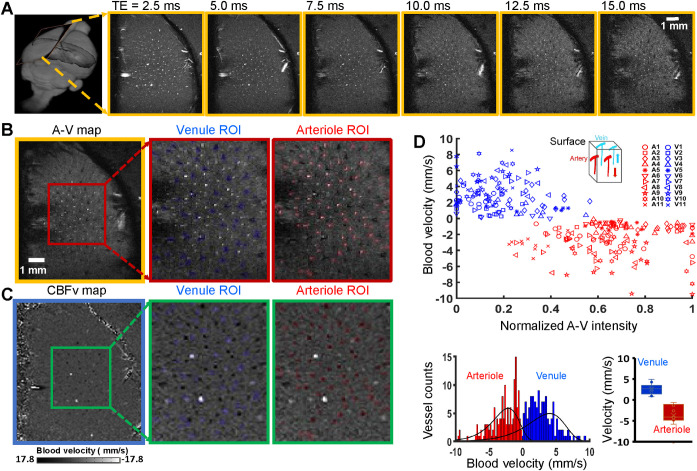
Fig 2. PC-based single-vessel flow velocity (CBFv) mapping.
(A) Representative 2D MGE slices (yellow boxes) from a deep layer of the primary forepaw somatosensory cortex (first frame) at different TEs, as indicated. (B) The 2D A–V map (yellow box) derived from the images with different TEs in panel A, arterioles, and venules appear as bright and dark voxels, respectively. The expanded views (red boxes) show individual venules, i.e., black voxels marked in blue, and arterioles, i.e., white voxels marked in red. (C) The vectorized flow velocity map (blue box) from the same 2D MGE slice in panel B. The expanded views (green boxes) show the individual venules, i.e., white dots with positive velocity, and arterioles, i.e., black dots with negative velocity. Note that 2 bright dots are caused by the “overflowed” velocity beyond the maximal velocity, i.e., the Venc parameter, defined in the PC-MRI sequence, which could be not correctly estimated. (D) Scatter plot of the flow velocities from individual arterioles and venules as the function of the normalized signal intensities of each vessel in the A–V map of panel B, data from 11 rats as indicated. Insert shows the blood flow direction of arterioles and venules in the forepaw somatosensory cortical region. The lower panel shows the histogram of the blood velocity distribution across arterioles and venules, as well as the bar graph to show the mean velocity. The data underlying this figure can be found in S2 Data. A–V, arteriole–venule; CBFv, cerebral blood flow–related velocity; MGE, multi-gradient echo; PC, phase contrast; ROI, region of interest; Venc, velocity encoding; TE, echo time.

