
Figure 2.
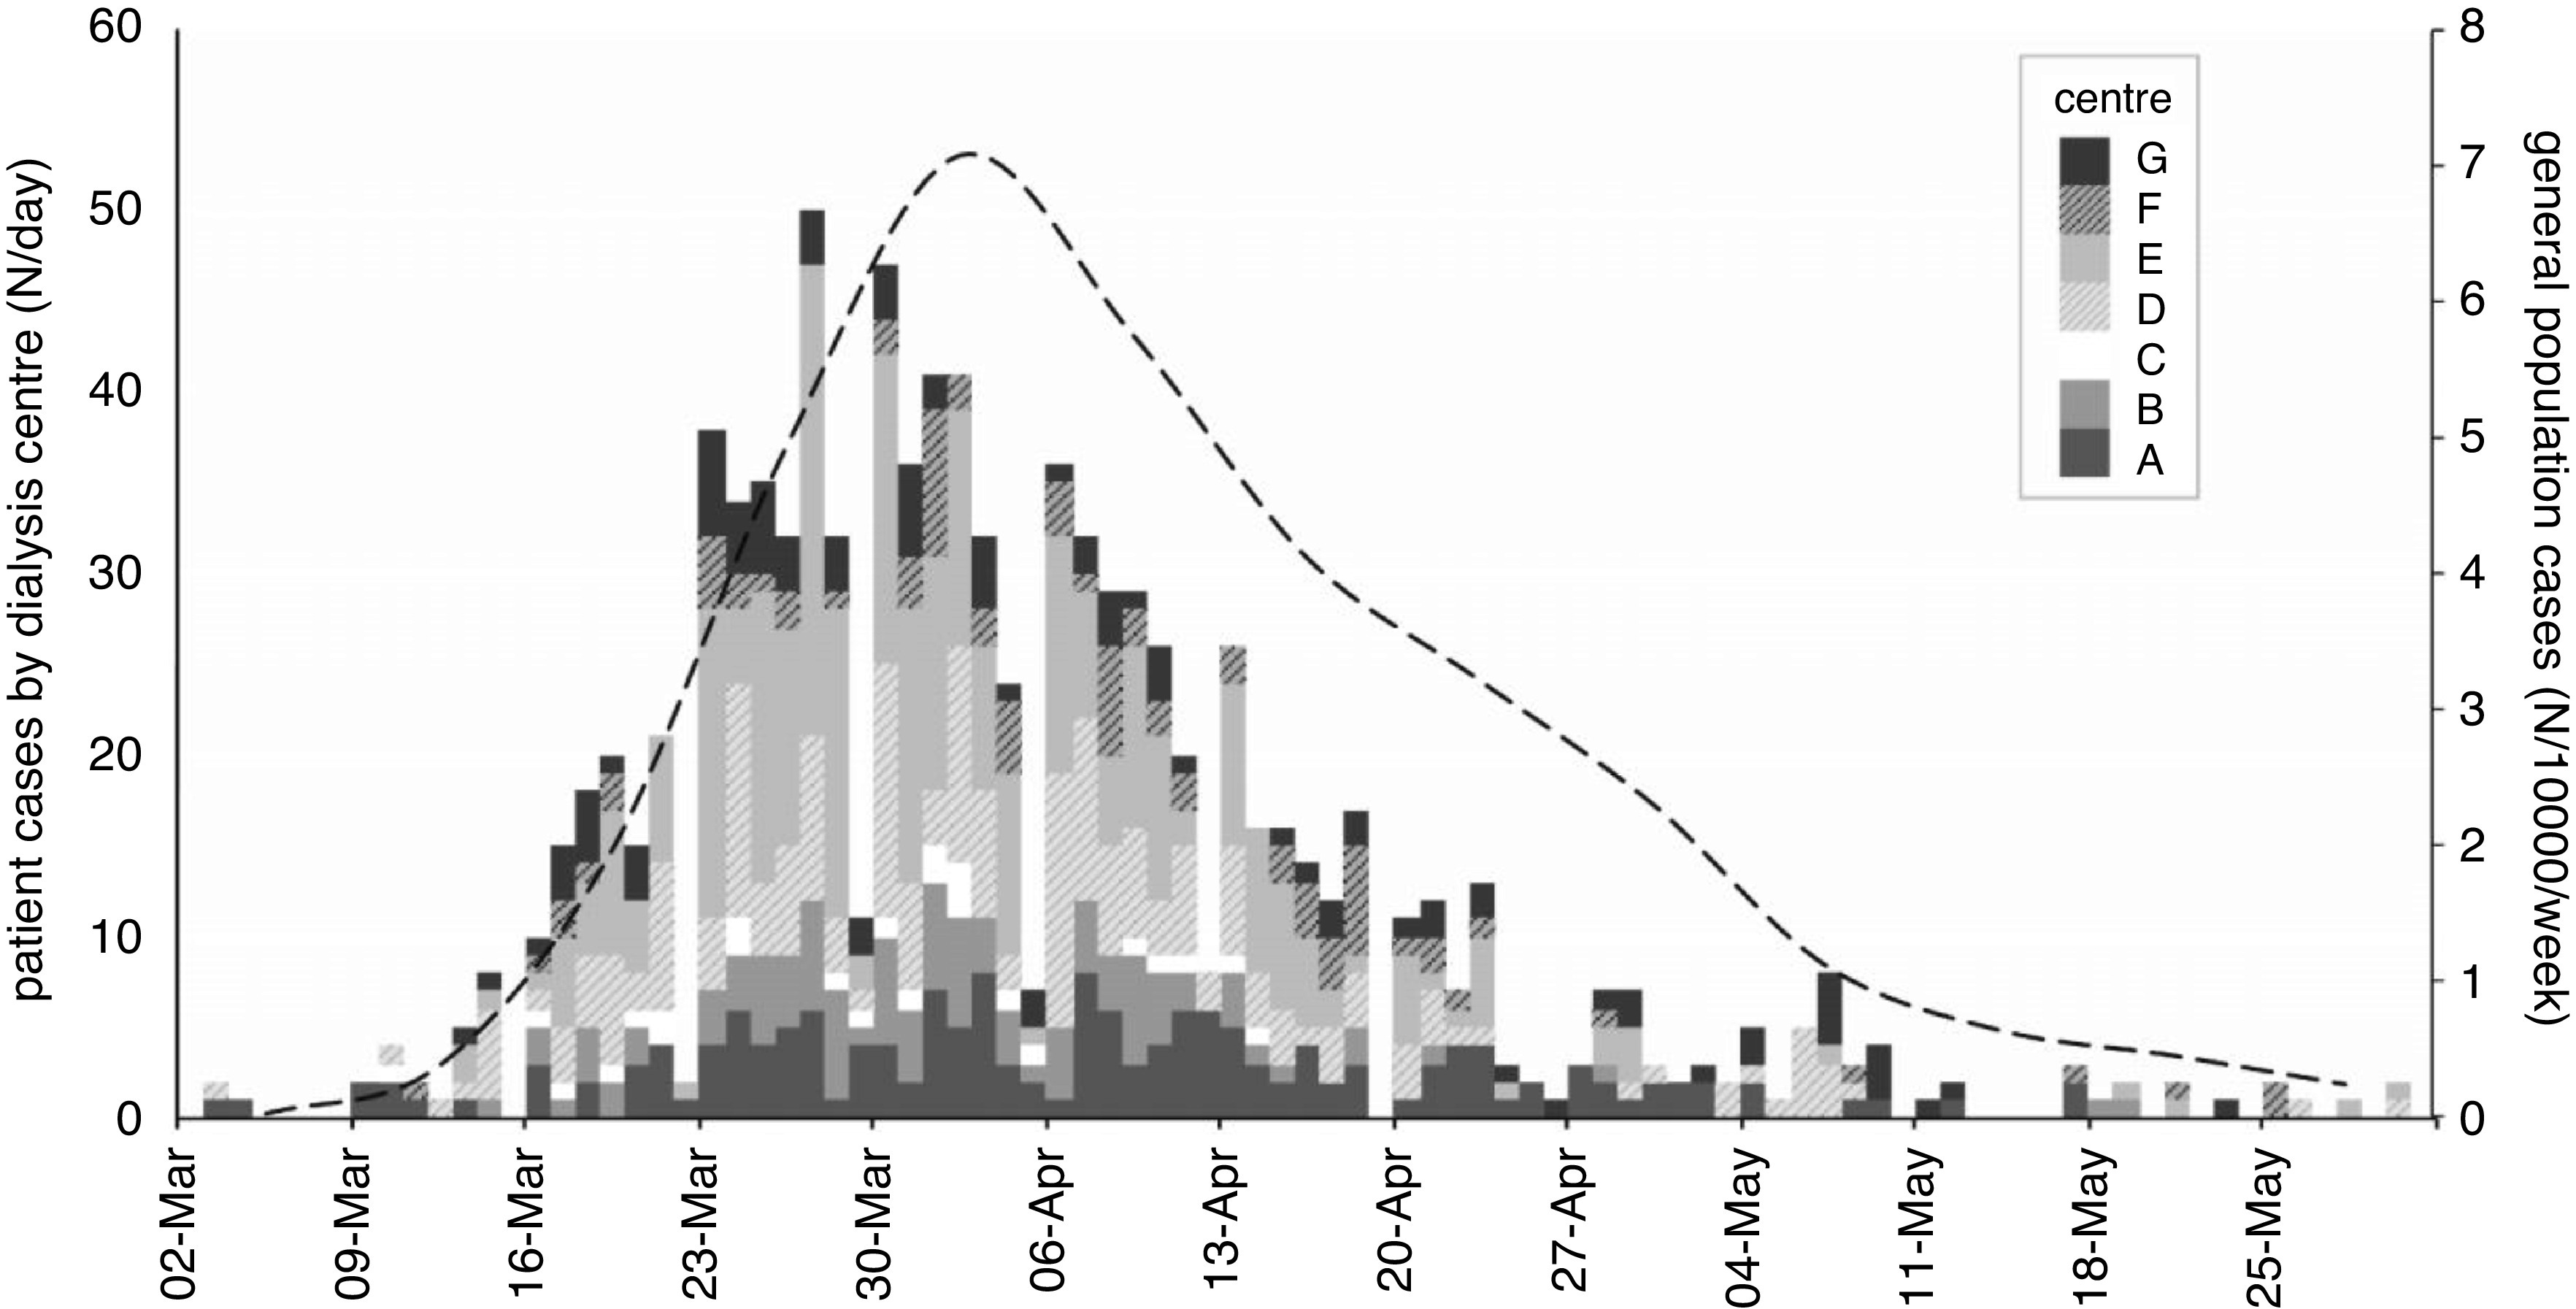
Epidemic timeline in patients on in-center hemodialysis across London. Patient cases (first of positive test or admission) by renal center expressed as actual numbers per day. Cases in the general population are available weekly by location and calculated by postcode per 10,000 population. The whole population average (dashed line) is weighted by the number of patients per postcode.