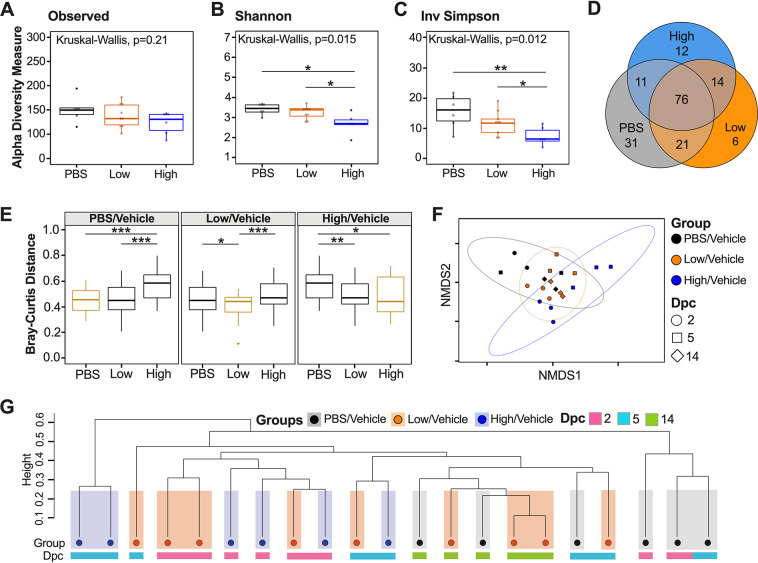
FIG 2.
Alpha and beta diversity metrics of cecum samples. Comparison of observed ASVs (A), Shannon diversity index (B) and Inv Simpson (C) of different groups (PBS/vehicle, black; low/vehicle, orange; high/vehicle, blue) containing all time points (dpc) from rarified ASV count table. (D) Venn diagram of rarified ASV counts comparing the three different groups. (E) Comparison of weighted Bray-Curtis dissimilarity distances within each group and across different groups. Gold boxes represent within-group variation, while black boxes represent the between-group variation. (F) NMDS plot of weighted Bray-Curtis dissimilarity distance. Days postchallenge are indicated by the shape, and groups are indicated by color. Ellipses were constructed using a multivariate t distribution. (G) Dendrogram showing the relationship of different groups and time points (dpc) using Bray-Curtis dissimilarity distance. Hierarchical cluster analysis was performed using hclust with agglomeration method average. Shaded colors and circles correspond to the different groups as described previously. Colored bars below the circles represent the different time points (pink, 2 dpc; light blue, 5 dpc; green, 14 dpc). All statistical tests were performed using Kruskal-Wallis or Wilcox-rank tests for pairwise comparisons. *, P < 0.05; **, P < 0.005; ***, P < 0.0005.

