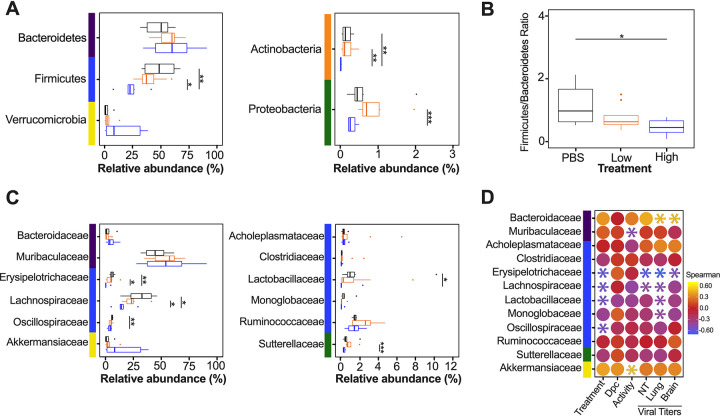
FIG 3.
Relative abundance (%) of microbial communities in the ceca at the phylum and family levels. (A) Relative abundances (%) of the most predominant phyla were compared via box plots for each group (PBS/vehicle, black; low/vehicle, orange; high/vehicle, blue). Each box represents the interquartile range (first and third quartiles) of taxon abundance, and the line corresponds to the median abundance. Vertical lines represent variation in abundance, and the circles represent outliers. Corresponding phyla are noted by the colored bars on the left (purple, Bacteroidetes; blue, Firmicutes; yellow, Verrucomicrobia; orange, Actinobacteria; green, Proteobacteria). (B) Firmicutes/Bacteroidetes ratios were calculated and graphed to analyze differences among different groups. (C) Relative abundances (%) of the most abundant families were compared via box plots. Corresponding phyla are noted by the colored bar on left and in accordance with those in panel A. (D) Spearman correlations by family abundance. Corresponding phyla are noted by the colored bar to the on the left and in accordance with those in panel A. Significant values (P < 0.05) are demonstrated as an asterisk, while nonsignificant correlations are as a circle. Correlative factors include treatment (administered PBS, a low dose, or high dose), days postchallenge (2, 5, or 14), activity score (response to the environment and personnel stimulation; higher score indicates decreased activity), or viral titers measured in the nasal turbinates (NT), lung, and brain. Data (activity score, viral titers in the NT, lung, and brain) were adapted from Cáceres et al. (43). All statistical tests were performed using the Wilcox-rank test. *, P < 0.05; **, P < 0.005; ***, P < 0.0005.

