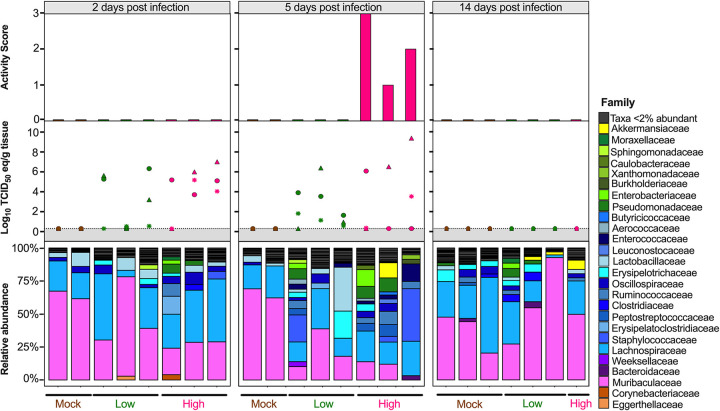
FIG 8.
Relative abundance (%) of microbial communities in the lung at the family level. Relative abundances (%) of individuals were calculated by agglomerating at the family level and then transformed into relative abundances. Taxa that had less than 2% abundance were grouped together. Groups are indicated by the bars at the bottom and by color (mock/GC-376, brown; low/GC-376, green; high/GC-376, pink). Each set of graphs is separated by time point indicated at the top. Viral nasal turbinates (circle), lung (triangle), and brain (asterisk) titers of individual mice that underwent microbial analysis are shown in the box above the microbial taxonomic abundances. Activity scores (response to the environment and personnel stimulation; higher score indicates decreased activity) for each mouse are shown above the viral titers. Data including activity score, viral titers in the NT, lung and brain were adapted from Cáceres et al. 2021 (43).

