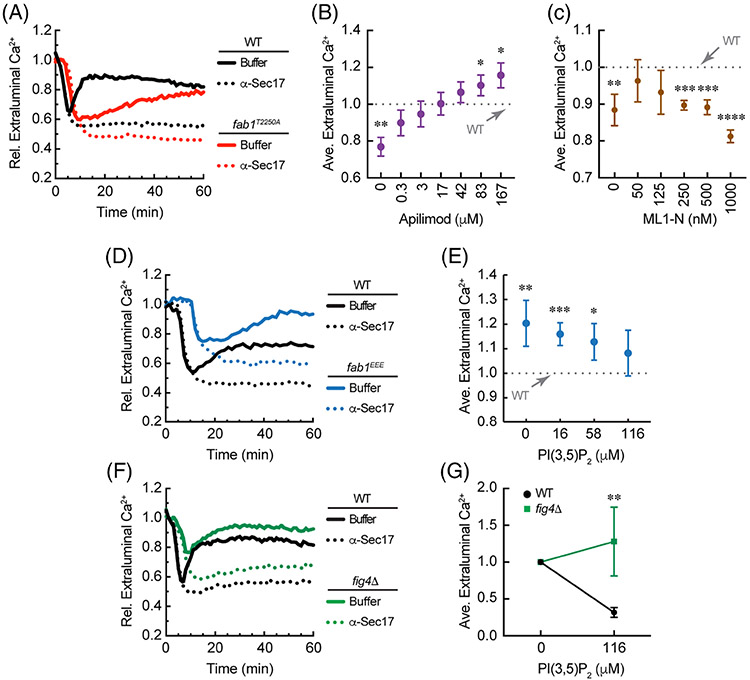
FIGURE 4.
FAB1 kinase mutations differentially affect Ca2+ transport. Vacuoles from wild type yeast were tested for Ca2+ transport in parallel with those from fab1T2250A (A), fab1EEE (D) or fig4Δ (F) yeast. B, Fab1T2250A vacuoles were incubated with a concentration range of Apilimod after 10 minutes of incubation. Reactions were then incubated for a total of 60 minutes. Average Ca2+ efflux values at 30 minutes of incubation were normalized relative to wild type given a value of 1 (dotted line). C, Fab1T2250A vacuoles were incubated with a concentration range of GST-ML1-N as done with Apilimod. Values were normalized to wild type efflux at 30 minutes. D, fab1EEE vacuoles were incubated with a dose curve of C8-PI(3,5)P2 and incubated in parallel with wild type vacuoles. Values were taken at 30 minutes and normalized wild type efflux without treatment at 30 minutes. E, Quantitation of fab1EEE vacuole flux in the presence of C8-PI(3,5)P2. Values were normalized to wild type efflux, which was set to 1. F, Wild type vacuoles were incubated in parallel with and fig4Δ vacuoles incubated with buffer or C8-PI(3,5)P2. Efflux values were taken at 30 minutes with or without treatment for wild type and fig4Δ vacuoles. G, Comparison of the maximal effects of C8-PI(3,5)P2 on Ca2+ flux between wild type and fig4Δ vacuoles. Values were normalized to the no treatment condition for each vacuole type. Error bars are SEM (n = 3). Significant differences were in comparison wild type. *P < .05, **P < .01, ***P < .001, ****P < .0001 (unpaired t test)

