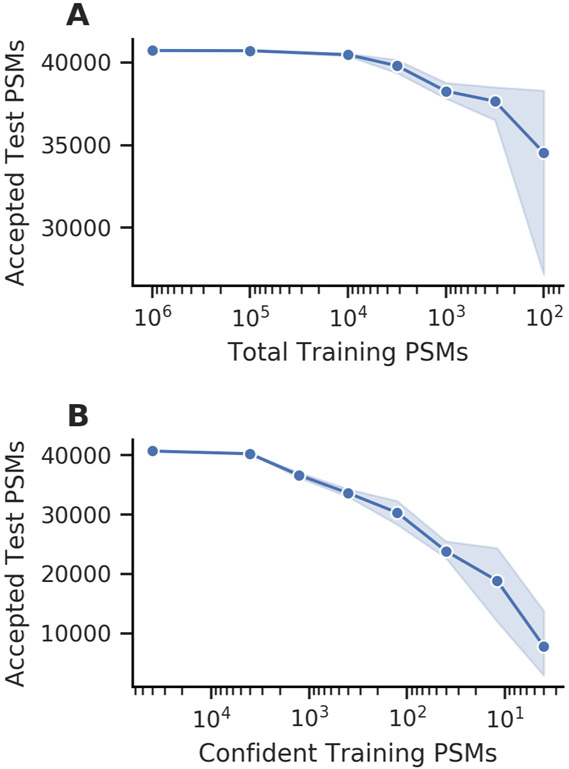
Figure 2:
The number of accepted test set PSMs at 1% FDR decreases with smaller training experiments. (A) Decreasing the total number of training PSMs resulted in a gradual decrease in performance and increased variability. (B) Decreasing the number of confident training PSMs resulted in a rapid decline in performance. The points indicate the mean of five random seeds and the shaded region indicates the 95% confidence interval.

