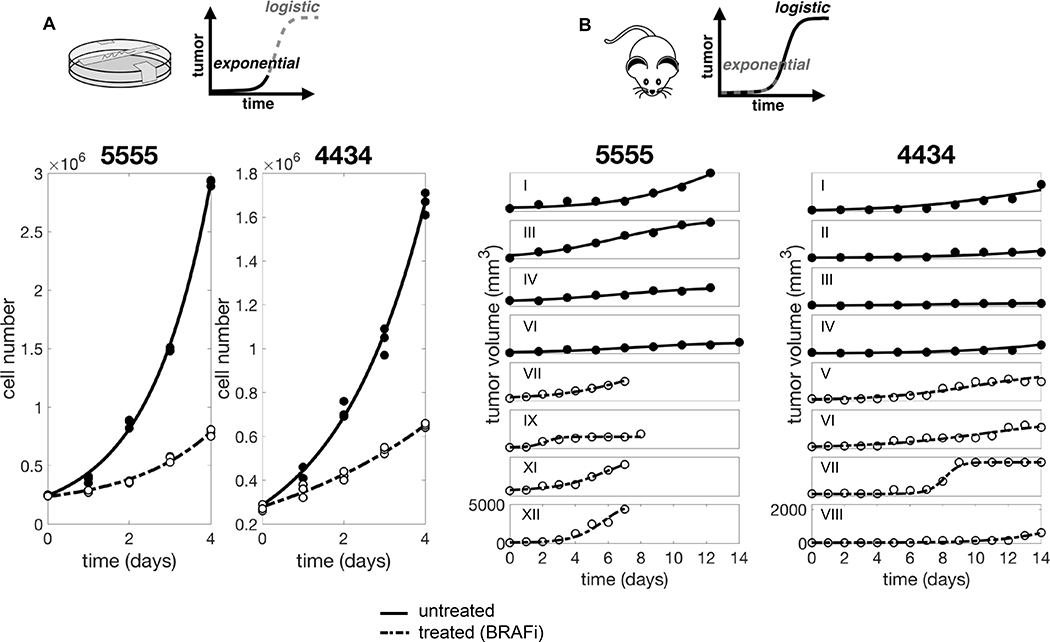
Figure 2.
Unpacking the relative contributions of intrinsic resistance and extrinsic environment conferred tolerance (EMDR). A. In vitro data and fit. For each condition we obtained one estimate that best fits the three replicates at the same time. B. In vivo data and fit. Data consist of six and four untreated 5555 and 4434 mice, respectively, and six and five BRAFi treated 5555 and 4434 mice, respectively. Only few representative mice are shown. For each condition the model is fitted individually to each replicate (mouse). Solid and dashed lines correspond to untreated and BRAFi treated tumor, respectively. Note different y axis scale for the two cell lines. Data from [13].

