. Author manuscript; available in PMC: 2021 Sep 21.
Published in final edited form as: Cancer Res. 2017 Jul 28;77(19):5409–5418. doi: 10.1158/0008-5472.CAN-17-0835

Table 1.

Summary of experimental conditions, corresponding model, and set of parameters to be estimated

Experimental Model Mathematical Model Analytical Solution Parameters
graphic file with name nihms-895889-t0006.jpg {dSdt=ρSSdRdt=0 S(t)=S0exp(ρSt);R(t)=R0. S0, R0, ρS
graphic file with name nihms-895889-t0007.jpg {dSdt=0dRdt=ρRR S(t)=S0R(t)=R0exp(ρRt). S0, R0, ρR
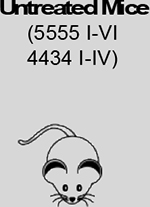
graphic file with name nihms-895889-t0008.jpg {dSdt=ρSS(1S+RK)dRdt=0dFdt=0dAdt=0 S(t)=KR01+(KR0S01)exp[(R0K1)ρSt];R(t)=R0;F(t)=F0;A(t)=0. S0, R0, K
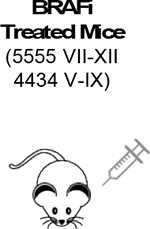
graphic file with name nihms-895889-t0009.jpg {dSdt=0dRdt=(ρR+ηA)R(1S+RK)dFdt=θFdAdt=θF S(t)=S0;R(t)=KS01+(KS0R01)exp[(S0K1)((ρR+η˜)tη˜θ(1eθt))];F(t)=F0exp(θt);A(t)=F0(1exp(θt)); S0,R0,η˜(η˜=ηF0)
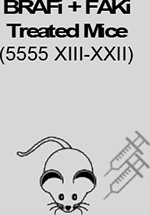
graphic file with name nihms-895889-t0010.jpg {dSdt=0dRdt=(ρR+(ηα)A)R(1S+RK)dFdt=θFdAdt=θF S(t)=S0;R(t)=KS01+(KS0R01)exp[(S0K1)((ρR+η˜α˜)tη˜α˜θ(1eθt))];F(t)=F0exp(θt);A(t)=F0(1exp(θt)); S0,R0,α˜(α˜=αF0)

Data are fitted to S(t) + R(t).

Initial conditions for cell line model are: S(0) = S0, R(0) = R0, for mouse model: S(0) = S0, R(0) = R0, F(0) = F0, A(0) = 0.

Note that S0 and R0 represent different quantities depending on the model (cell count for cell line model, and tumor volume for mouse model).