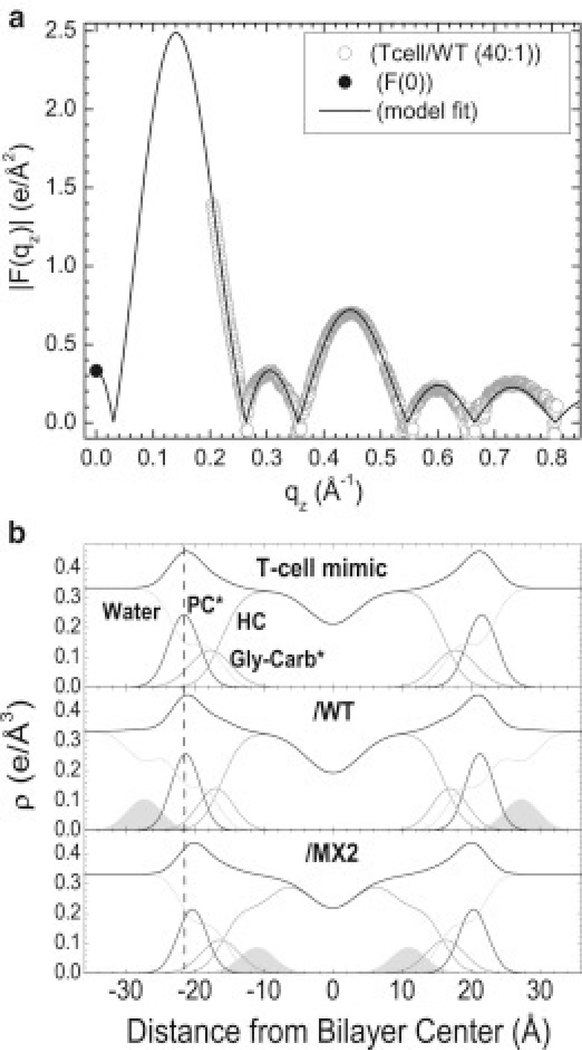
Figure 13.
(a) Model fit to |F(qz)| obtained from X-ray data and F(0) obtained from volumetric data for T-cell/WT. (b) Electron density profiles for T-cell mimic control with WT and MX2 at 40:1 lipid:peptide molar ratio. The component groups are water, PC* (phosphocholine*), Gly-carb* (glycerol plus carbonyls*), HC (lipid hydrocarbon chains plus cholesterol), and LLP2 peptides (shaded). * indicates a weighted average group. Vertical dotted line facilitates comparison of membrane thickness. Figure from Ref. [15].

