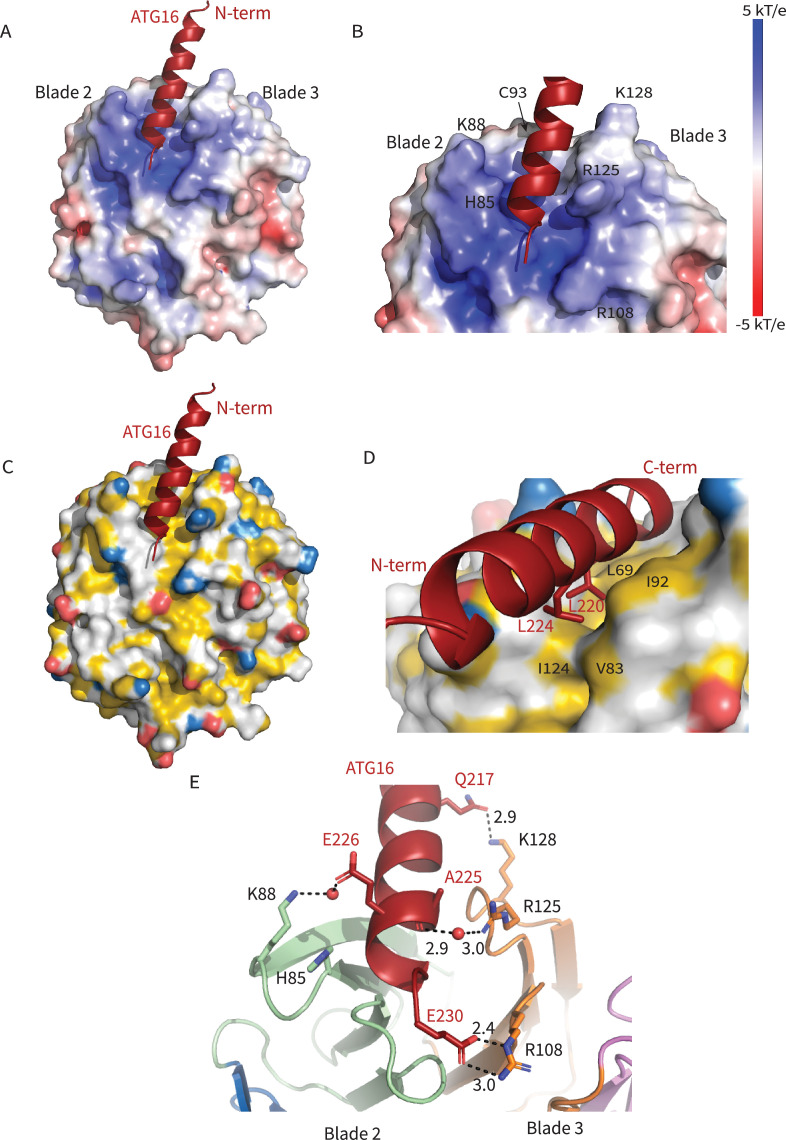
Figure 2. Interactions at the interface.
Analysis of the Interface. (A) Overall electrostatic surface and (B) closer view of electrostatic surface with ATG16 W2IR shown as a cartoon and key residues labeled. (C) Overall hydrophobic surface of WIPI2d and (D) closer view of the hydrophobic interface with key residues labeled where yellow represents hydrophobic regions. (E) A cartoon and stick representation of hydrogen bonds between ATG16 and WIPI2d shown as black dotted lines with distances noted and key residues shown as sticks.

