. 2021 Aug 24;10:e70990. doi: 10.7554/eLife.70990

Figure 2. Stable homolog pairing requires double-strand breaks (DSBs) and strand invasion.

(A) Diagram showing the locations of tandem repeat sequences used to generate DNA FISH probes for pairing analysis in P. pacificus. (B) Representative images show the progression of homolog pairing of chromosome X (magenta) and chromosome IV (yellow) during meiotic prophase in wild-type hermaphrodites. Premeiotic region (PM), transition zone (TZ), and pachytene (Pach). Scale bar, 5 μm. (C) Representative images of FISH probe signals in spo-11, dmc-1, and rad-51 mutants during mid-prophase stage (roughly equivalent to the pachytene stage in wild-type germlines). Scale bar, 5 μm. (D) Temporal progression of X and IV chromosome pairing in WT, spo-11, dmc-1, and rad-51 mutants. Graphs show the distribution of distances within each of five equally sized zones spanning meiotic prophase. (E) Distance between pairs of heterologous FISH signals was measured in premeiotic (PM) and transition zone (TZ) nuclei in WT, spo-11, dmc-1, and rad-51 mutants (spanning zones 1 and 2 only). Distances between pairs of homologous FISH signals (Chr. X and IV combined) in TZ nuclei are included for comparison. ***p<0.0001, by Student’s t-test. See also Figure 2—figure supplement 1, Figure 2—figure supplement 2, and Figure 2—source data 1.

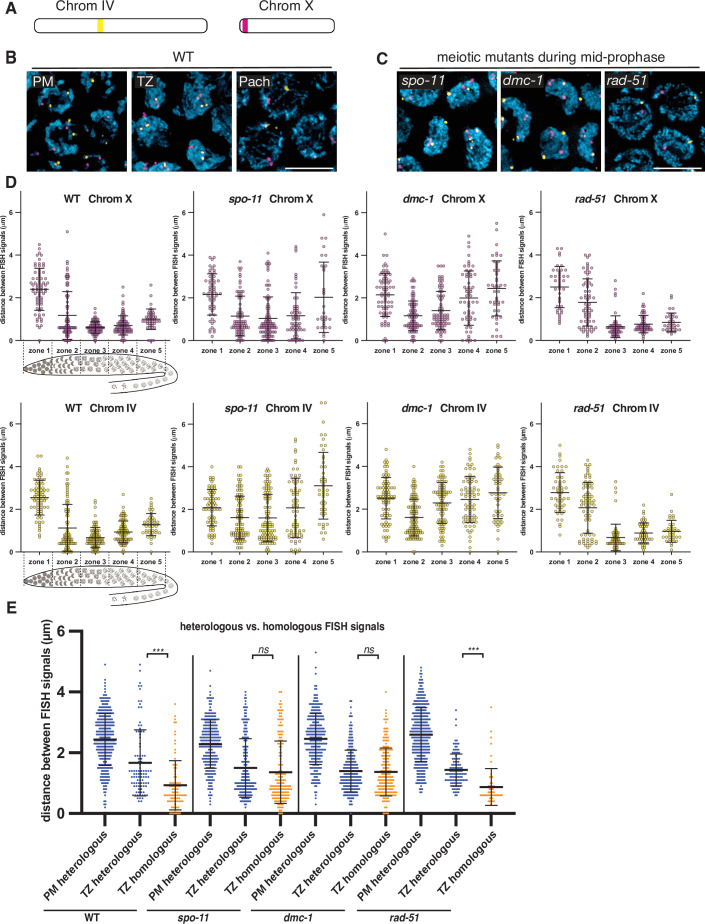
Figure 2—source data 1. Distances between FISH signals plotted in Figure 2.

Figure 2.

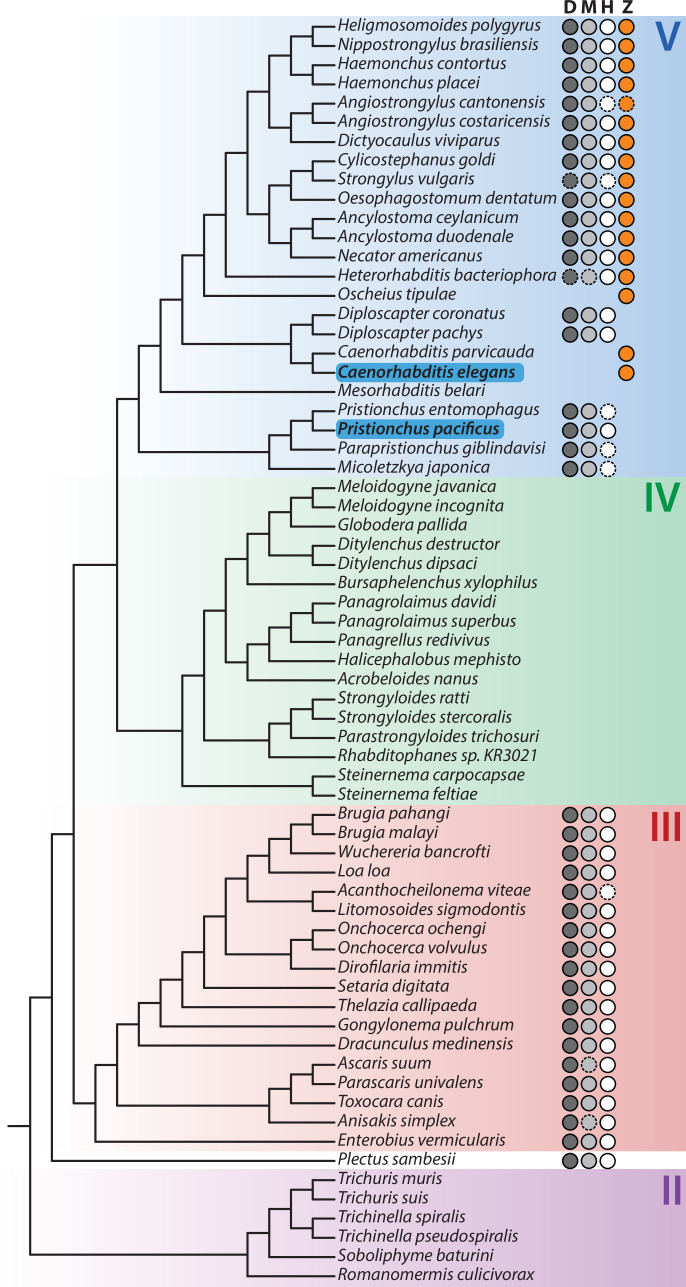
Figure 2—figure supplement 1. Presence of meiotic pairing proteins across the nematode phylogeny.

Figure 2—figure supplement 1.

D: Dmc1; M: Mnd1; H: Hop2; Z: HIM-8/ZIM-1,2,3. Circles indicate the presence of a homolog; solid outlines indicate homologs identified via orthology clustering; dashed outlines represent evidence of a homolog from TBLASTN searches of the genome sequence. C. elegans and P. pacificus are highlighted in blue. Major nematode clades are highlighted. Phylogeny rooted on two tardigrade species (Hysibius exemplaris and Ramazzottius varieornatus); not shown. Branch lengths are not shown.
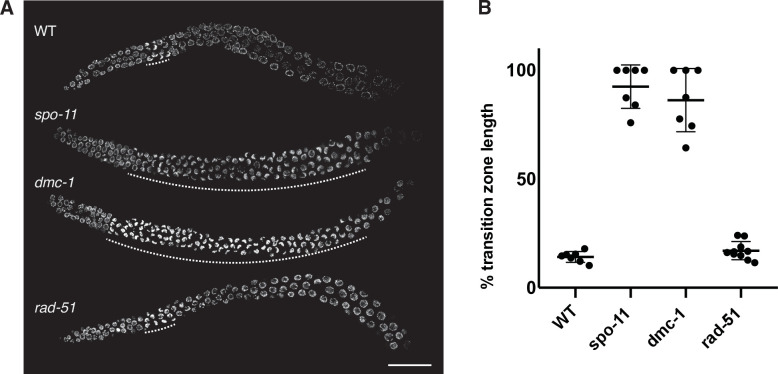
Figure 2—figure supplement 2. A prolonged region of polarized nuclear morphology ("transition zone" nuclei) is seen in spo-11 and dmc-1, but not in rad-51 mutants.

Figure 2—figure supplement 2.

(A) Composite projection images of whole gonads stained with DAPI from WT, spo-11, dmc-1, and rad-51 mutants. The extent of the transition zone of each gonad is indicated with dashed lines. Scale bar, 30 μm. (B) Quantification of transition zone length as a fraction of the distance from meiotic onset to the end of pachytene in WT (n = 7), spo-11 (n = 7), dmc-1 (n = 7), and rad-51 (n = 10). Error bars indicate mean ± SD. spo-11 and dmc-1 mutants show significant differences from WT (p<0.0001) but not Ppa-rad-51 (p=0.8426) by ordinary one-way ANOVA.