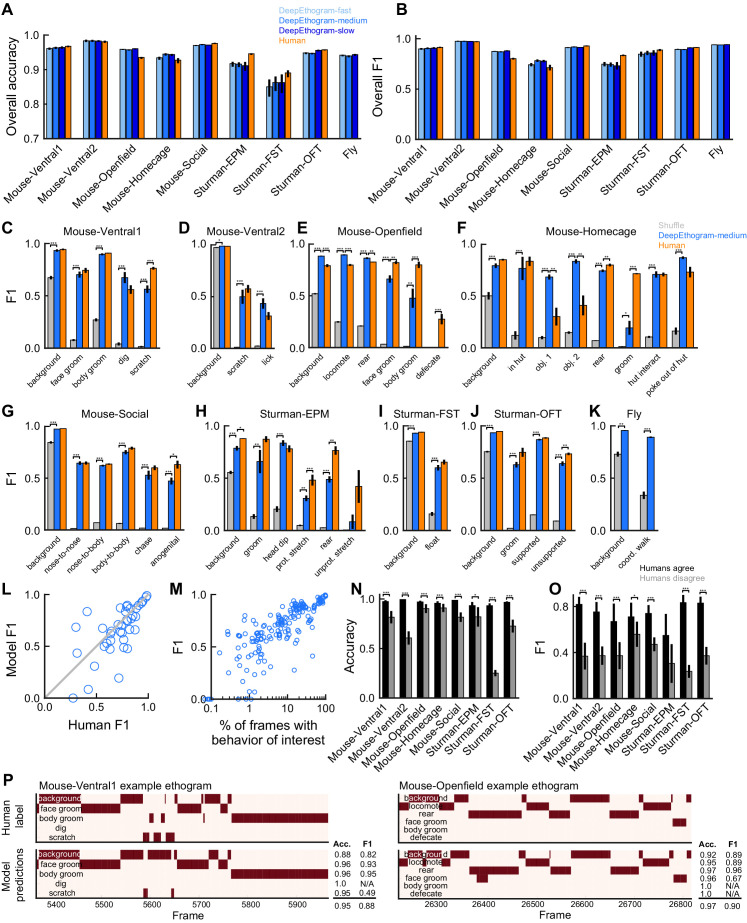
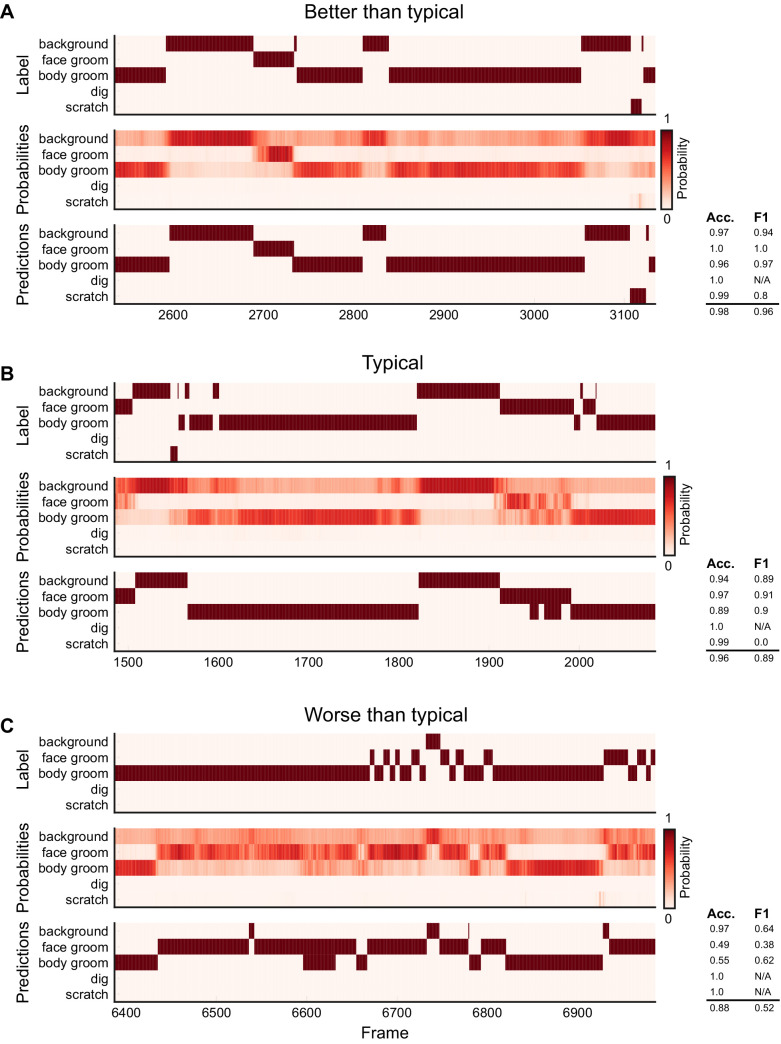
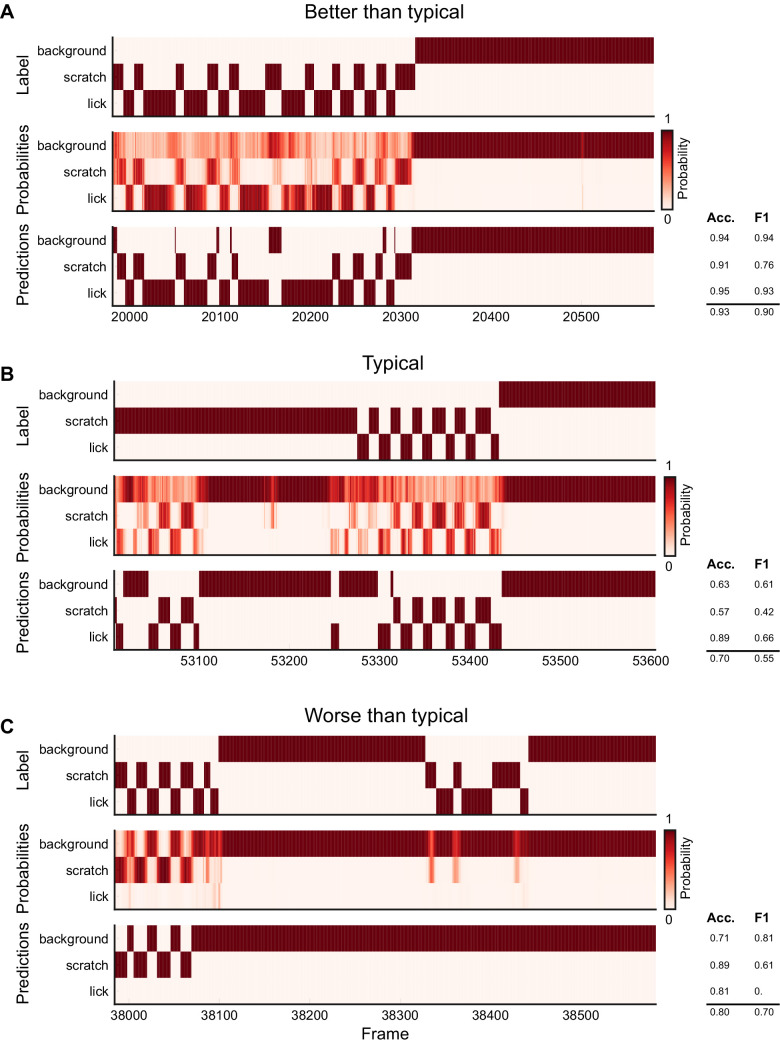
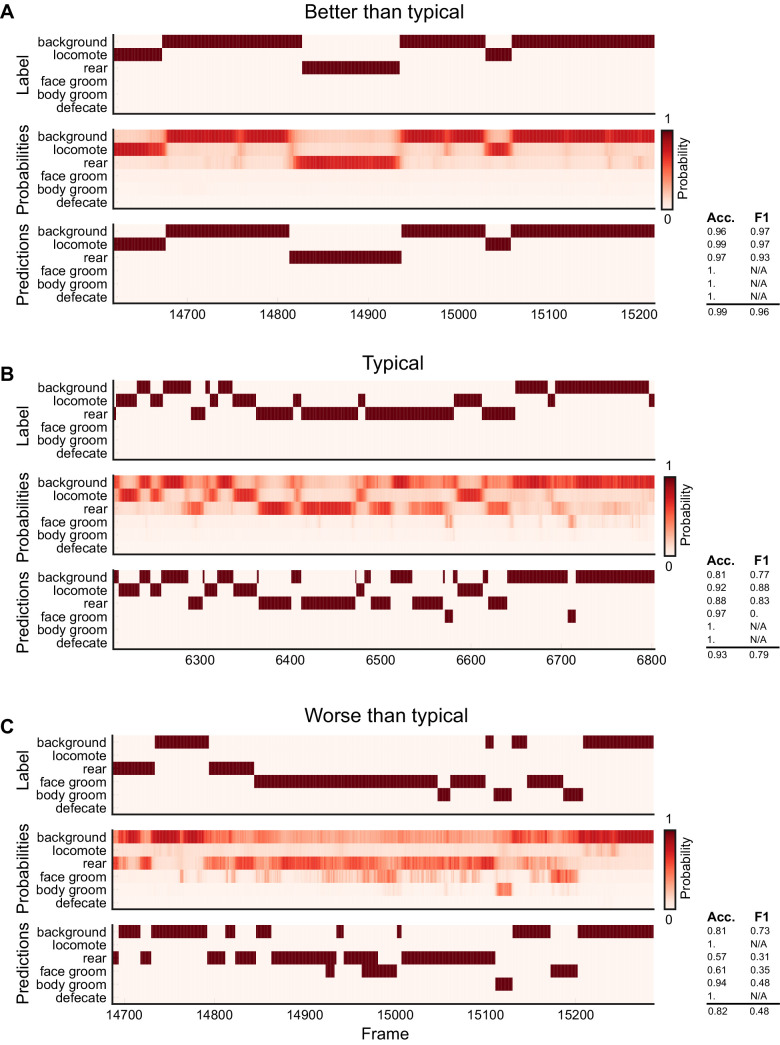
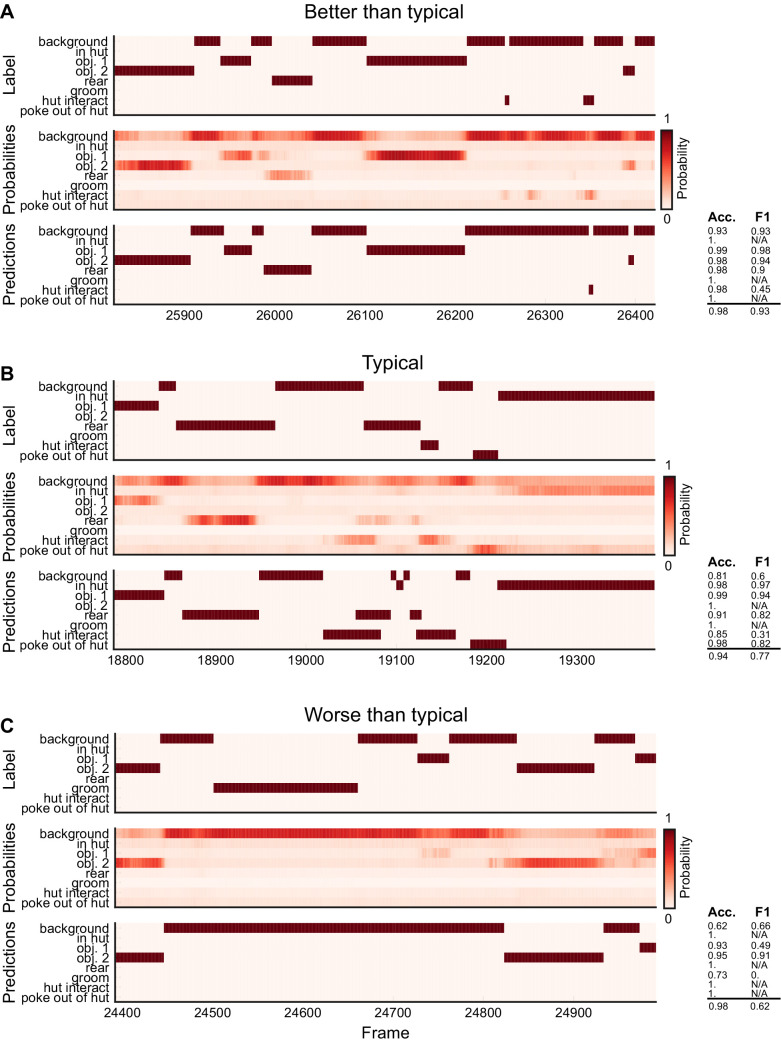
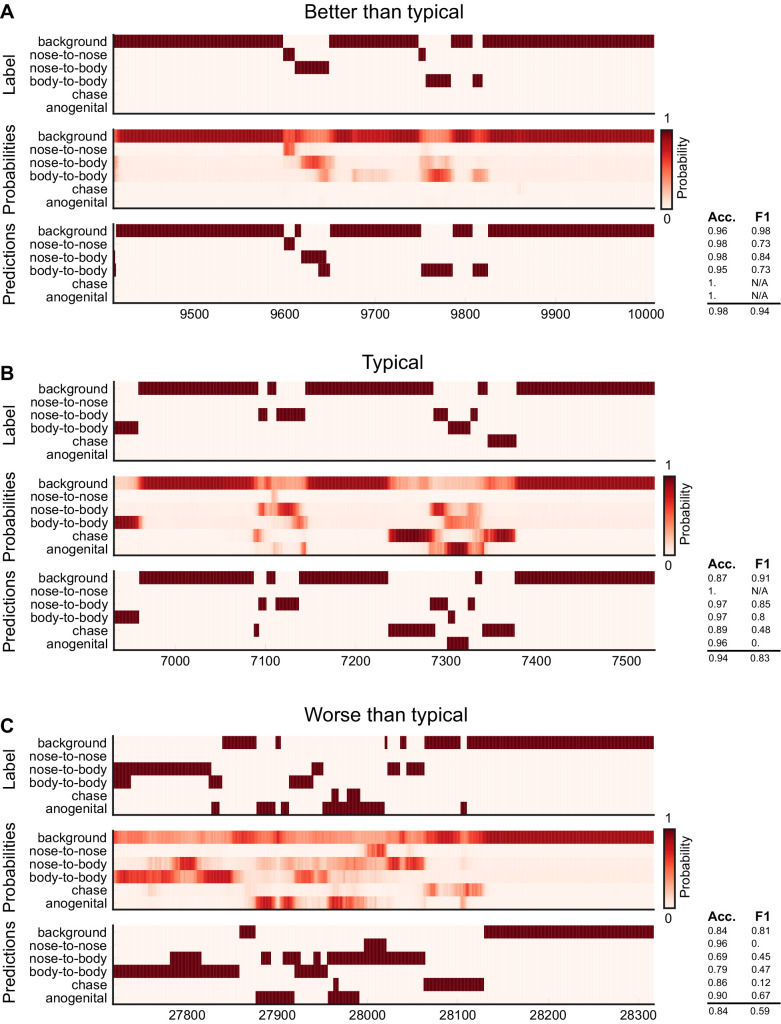
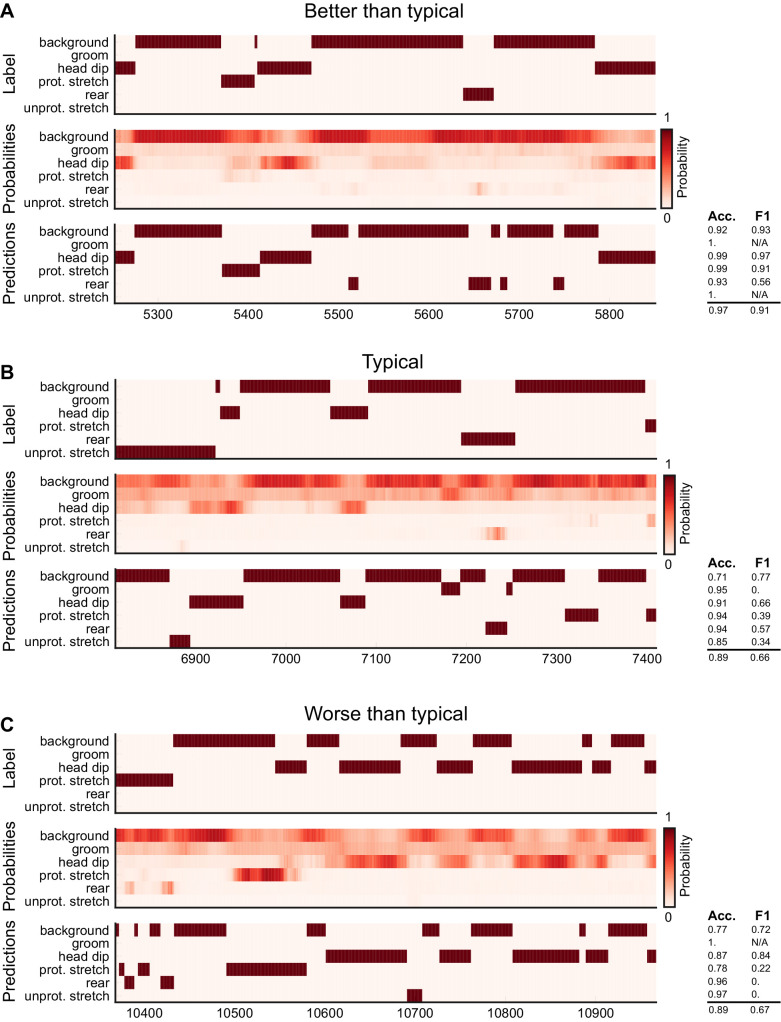
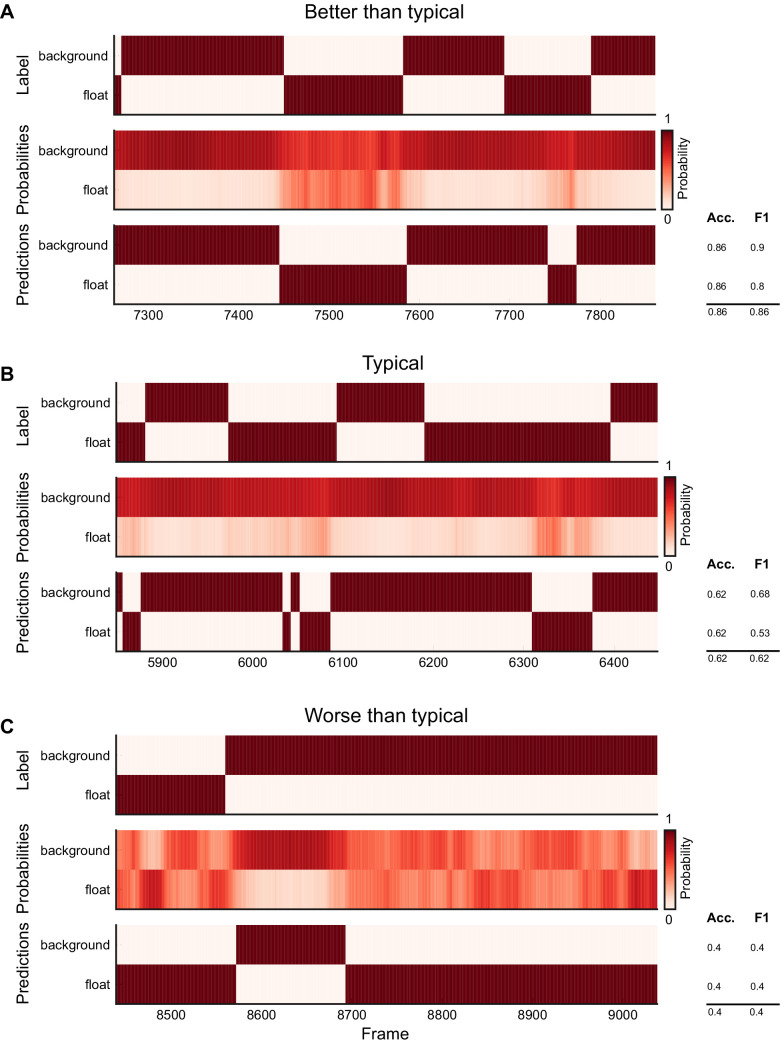
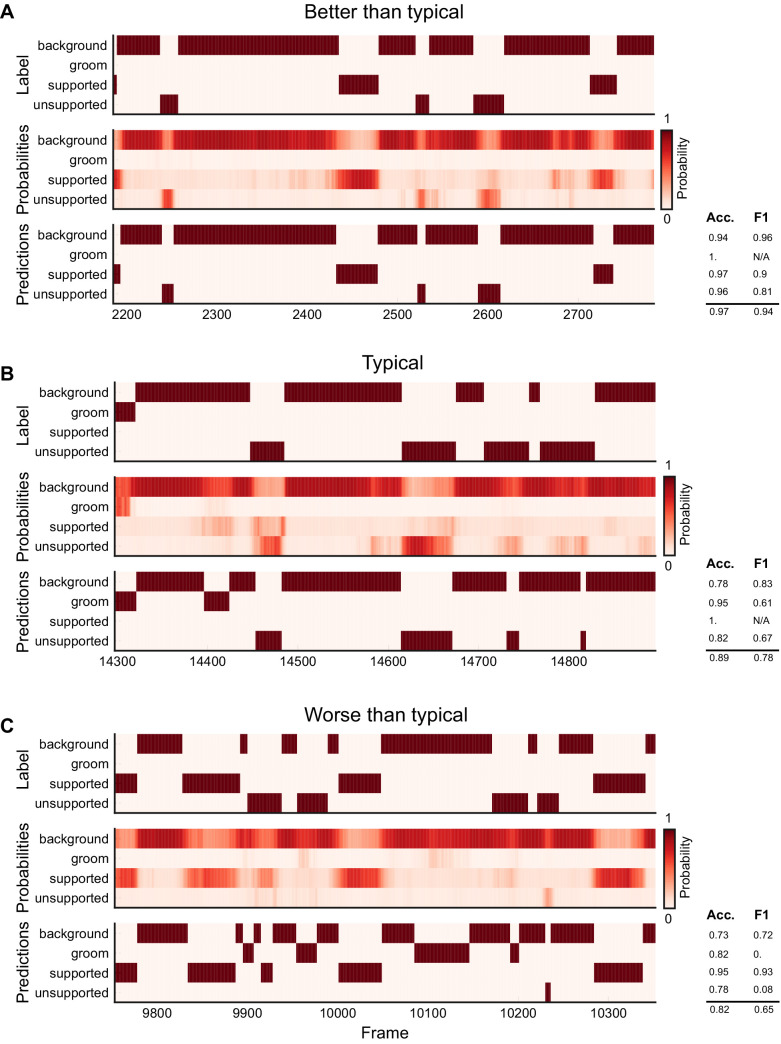
Figure 3. DeepEthogram performance.
All results are from the test sets only. (A) Overall accuracy for each model size and dataset. Error bars indicate mean ± SEM across five random splits of the data (three for Sturman-EPM). (B) Similar to (A), except for overall F1 score. (C) F1 score for DeepEthogram-medium for individual behaviors on the Mouse-Ventral1 dataset. Gray bars indicate shuffle (Materials and methods). *p≤0.05, **p≤0.01, ***p≤0.001, repeated measures ANOVA with a post-hoc Tukey’s honestly significant difference test. (D) Similar to (C), but for Mouse-Ventral2. Model and shuffle were compared with paired t-tests with Bonferroni correction. (E) Similar to (C), but for Mouse-Openfield. (F) Similar to (D), but for Mouse-Homecage. (G) Similar to (D), but for Mouse-Social. (H) Similar to (C), but for Sturman-EPM. (I) Similar to (C), but for Sturman-FST. (J) Similar to (C), but for Sturman-OFT. (K) Similar to (D), but for Fly dataset. (L) F1 score on individual behaviors (circles) for DeepEthogram-medium vs. human performance. Circles indicate the average performance across splits for behaviors in datasets with multiple human labels. Gray line: unity. Model vs. human performance: p=0.067, paired t-test. (M) Model F1 vs. the percent of frames in the training set with the given behavior. Each circle is one behavior for one split of the data. (N) Model accuracy on frames for which two human labelers agreed or disagreed. Paired t-tests with Bonferroni correction. (O) Similar to (N), but for F1. (P) Ethogram examples. Dark color indicates the behavior is present. Top: human labels. Bottom: DeepEthogram-medium predictions. The accuracy and F1 score for each behavior, and the overall accuracy and F1 scores are shown. Examples were chosen to be similar to the model’s average by behavior.

