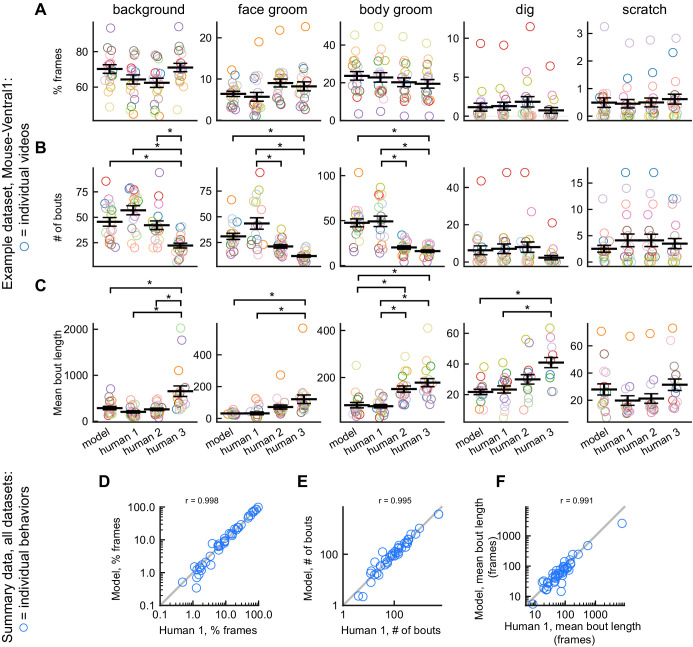
Figure 4. DeepEthogram performance on bout statistics.
All results from DeepEthogram-medium, test set only. (A–C) Comparison of model predictions and human labels on individual videos from the Mouse-Ventral1 dataset. Each point is one behavior from one video. Colors indicate video ID. Error bars: mean ± SEM (n = 18 videos). Asterisks indicate p<0.05, one-way ANOVA with Tukey’s multiple comparison test. No asterisk indicates p>0.05. (D–F) Comparison of model predictions and human labels on all behaviors for all datasets. Each circle is one behavior from one dataset, averaged across splits of the data. Gray line: unity.

