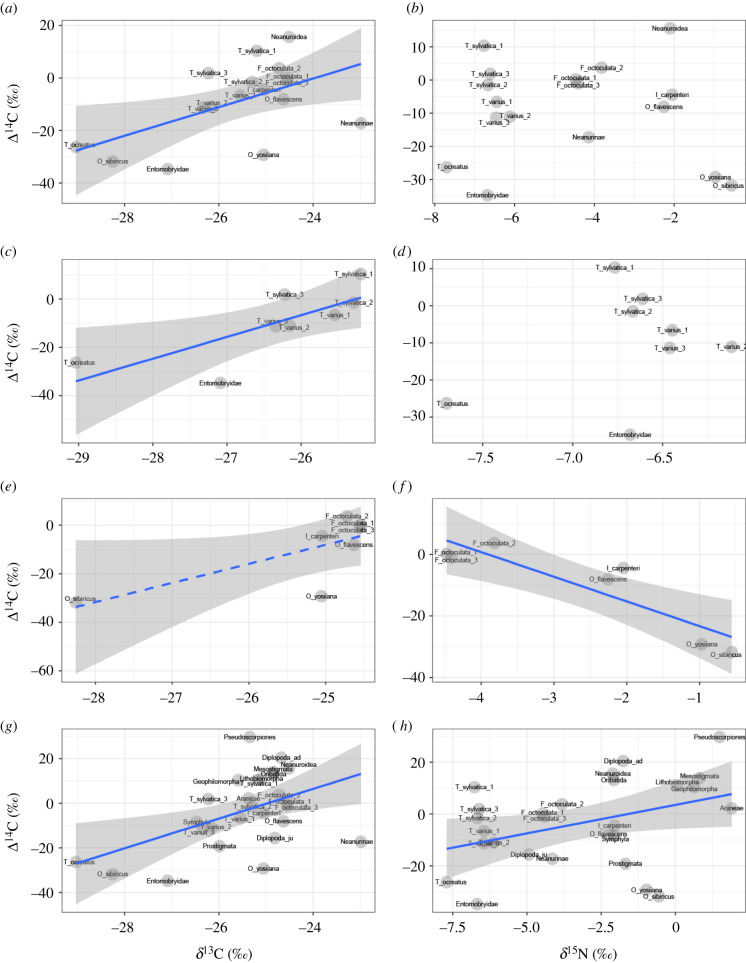
Figure 2.
Correlations between (a) δ13C and Δ14C and (b) δ15N and Δ14C for all collembolan species combined, between (c) δ13C and Δ14C and (d) δ15N and Δ14C for the epigeic collembolan species (i.e. L-layer inhabitants), between (e) δ13C and Δ14C and (f) δ15N and Δ14C for the edaphic collembolan species (i.e. FH-layer inhabitants), and between (g) δ13C and Δ14C and (h) δ15N and Δ14C for all taxa combined. Abbreviations for collembolan species are shown in table 1. Solid lines show significant relationships (p < 0.05), while a dashed line shows a marginally significant relationship (p < 0.1) between variables. Shaded areas represent 95% confidence intervals.

