
Figure 3.
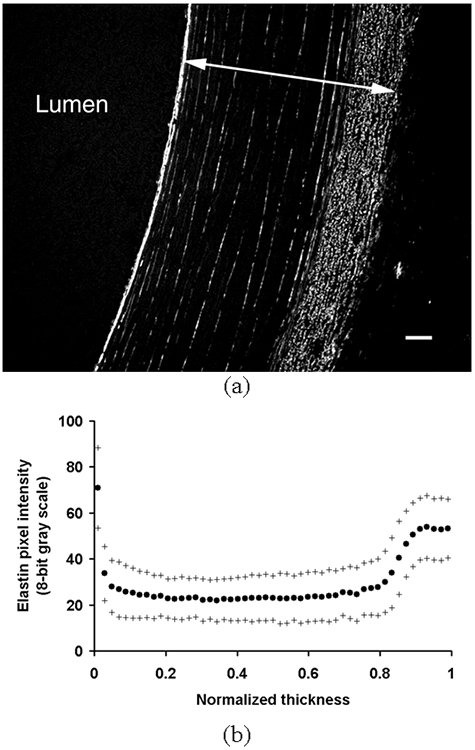
(a) A representative image of elastin structure taken from arteries fixed at 100 mmHg and in vivo stretch (λ = 1.5). An arrow indicates one normalized thickness. Bar = 50 μm. (b) The average area intensity of pixels due to elastin autofluorescence in each layer was plotted against the normalized thickness as mean (•) ± S.D. (+) (n = 5).