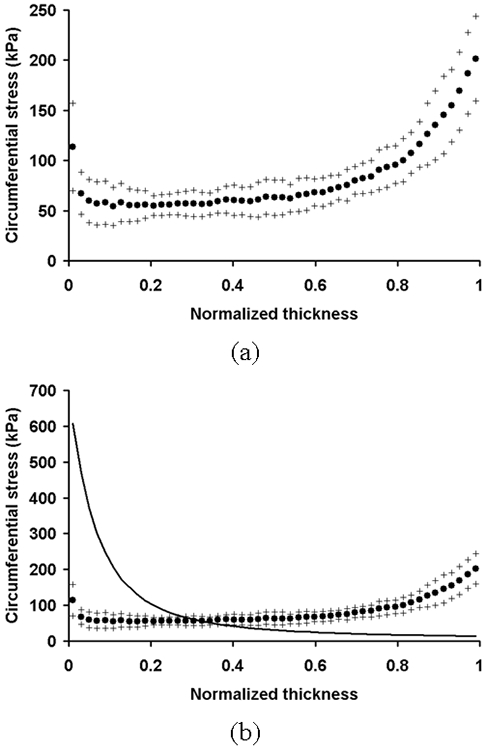
Figure 5.

(a) The distribution of circumferential stress computed using the heterogeneous model. The circumferential stress in each layer computed using the heterogeneous model was plotted against the normalized thickness as mean (•) ± S.D. (+) (n = 5). (b) The distribution of circumferential stress computed using the homogeneous model (solid line). It is plotted with the circumferential stress distribution in the heterogeneous model.
