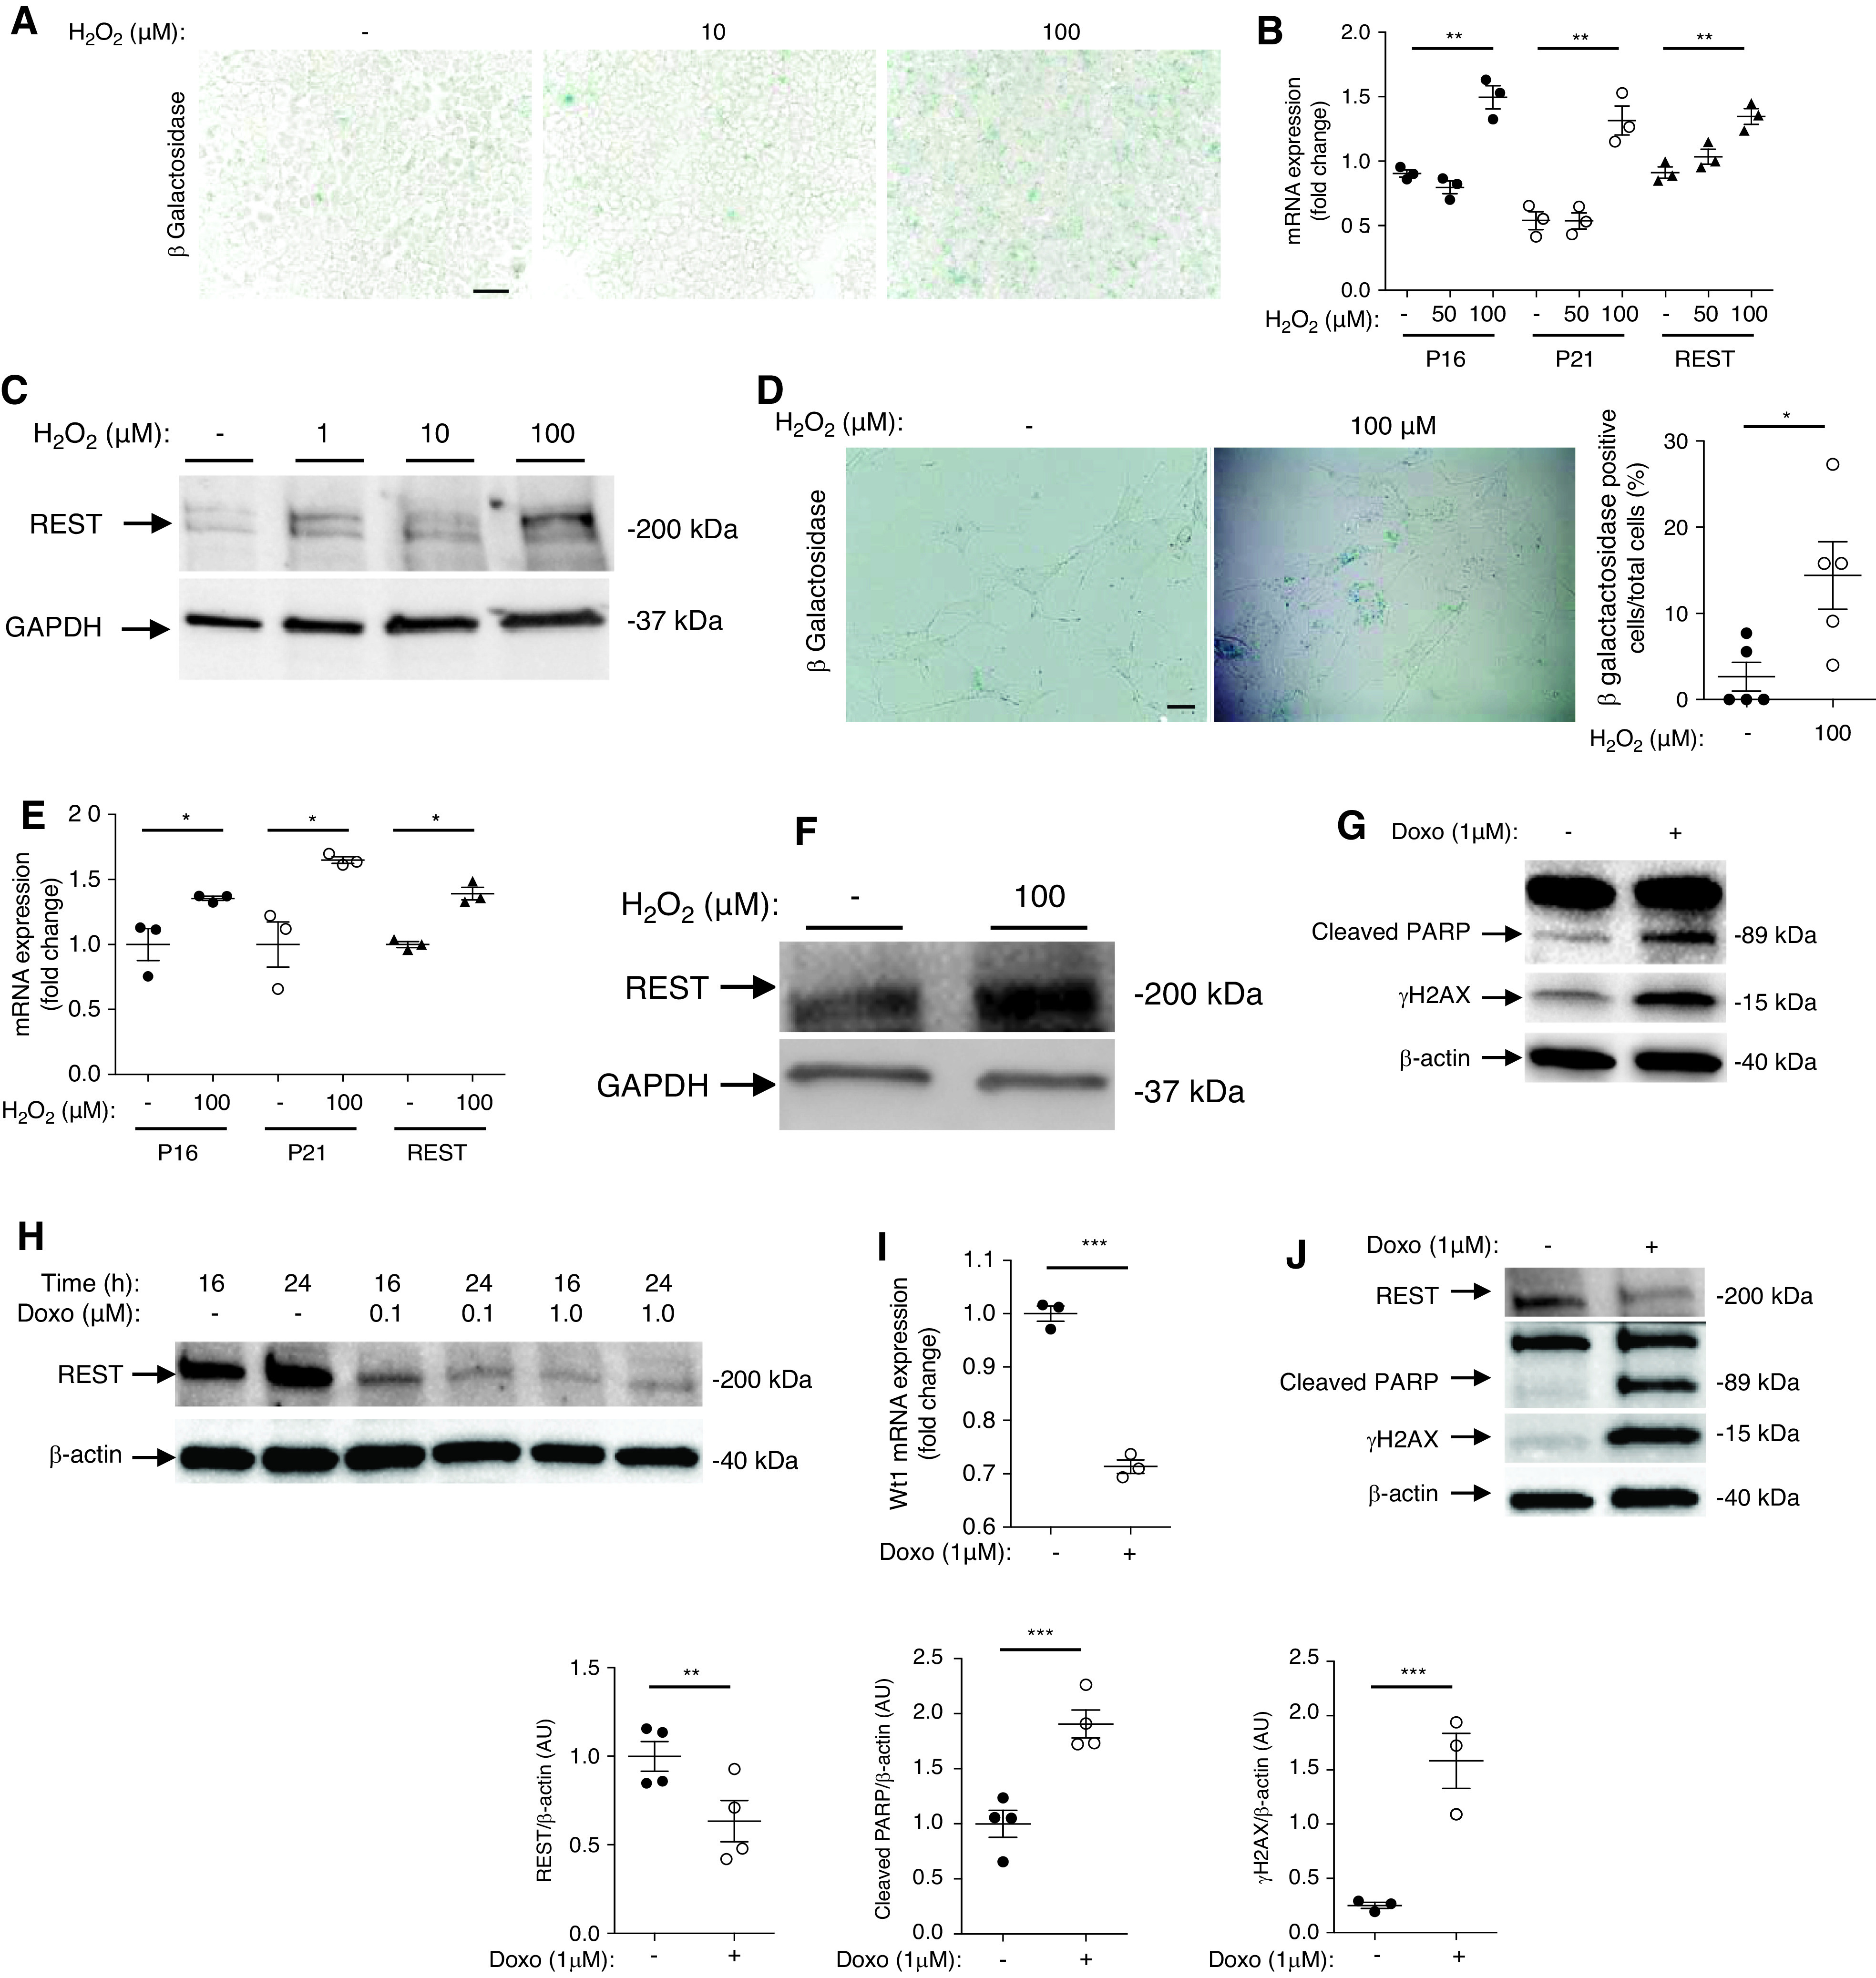
Figure 2.

REST induction by podocyte oxidative stress and injury. (A) β-galactosidase staining of 0, 10, and 100 μM H2O2 treated HEK cells (n=3 experiments). Scale bar, 5 μm. (B) RT-qPCR of P16, P21, and REST in HEK cells treated with 0, 50, and 100 μM of H2O2 (n=3 different experiments). (C) Western blot of REST in 0, 10, and 100 μM H2O2 treated HEK cells. (D) β-galactosidase staining and quantification of primary culture of GFP-podocytes exposed to either 0 or 100 μM H2O2 (n=4 experiments). Scale bar, 5 μm. (E) RT-qPCR of P16, P21, and REST in primary cultures of isolated GFP-podocytes exposed to 0 and 100 μM of H2O2 (n=3 experiments). (F) Western blot showing REST expression in primary cultures of isolated GFP-podocytes exposed to 0 and 100 μM of H2O2. (G) Western blot showing cleaved PARP and γH2AX expression in HEK cells treated with either 0 or 1 μM of doxorubicin (n=4 experiments). (H) Western blot of REST in HEK cells exposed to 0, 0.1, and 1 μM of doxorubicin. (I) WT1 mRNA expression of primary cultures of isolated GFP-podocytes exposed to 1 μM of doxorubicin (n=3 experiments). (J) Western blot and quantification of REST, cleaved PARP, and γH2AX in primary culture of isolated GFP-podocytes exposed to1 μM of doxorubicin (n=4 experiments). All data are shown as the mean±SEM. *P<0.05, **P<0.01, ***P<0.001, ****P<0.0001 between groups, Mann–Whitney or t test.
