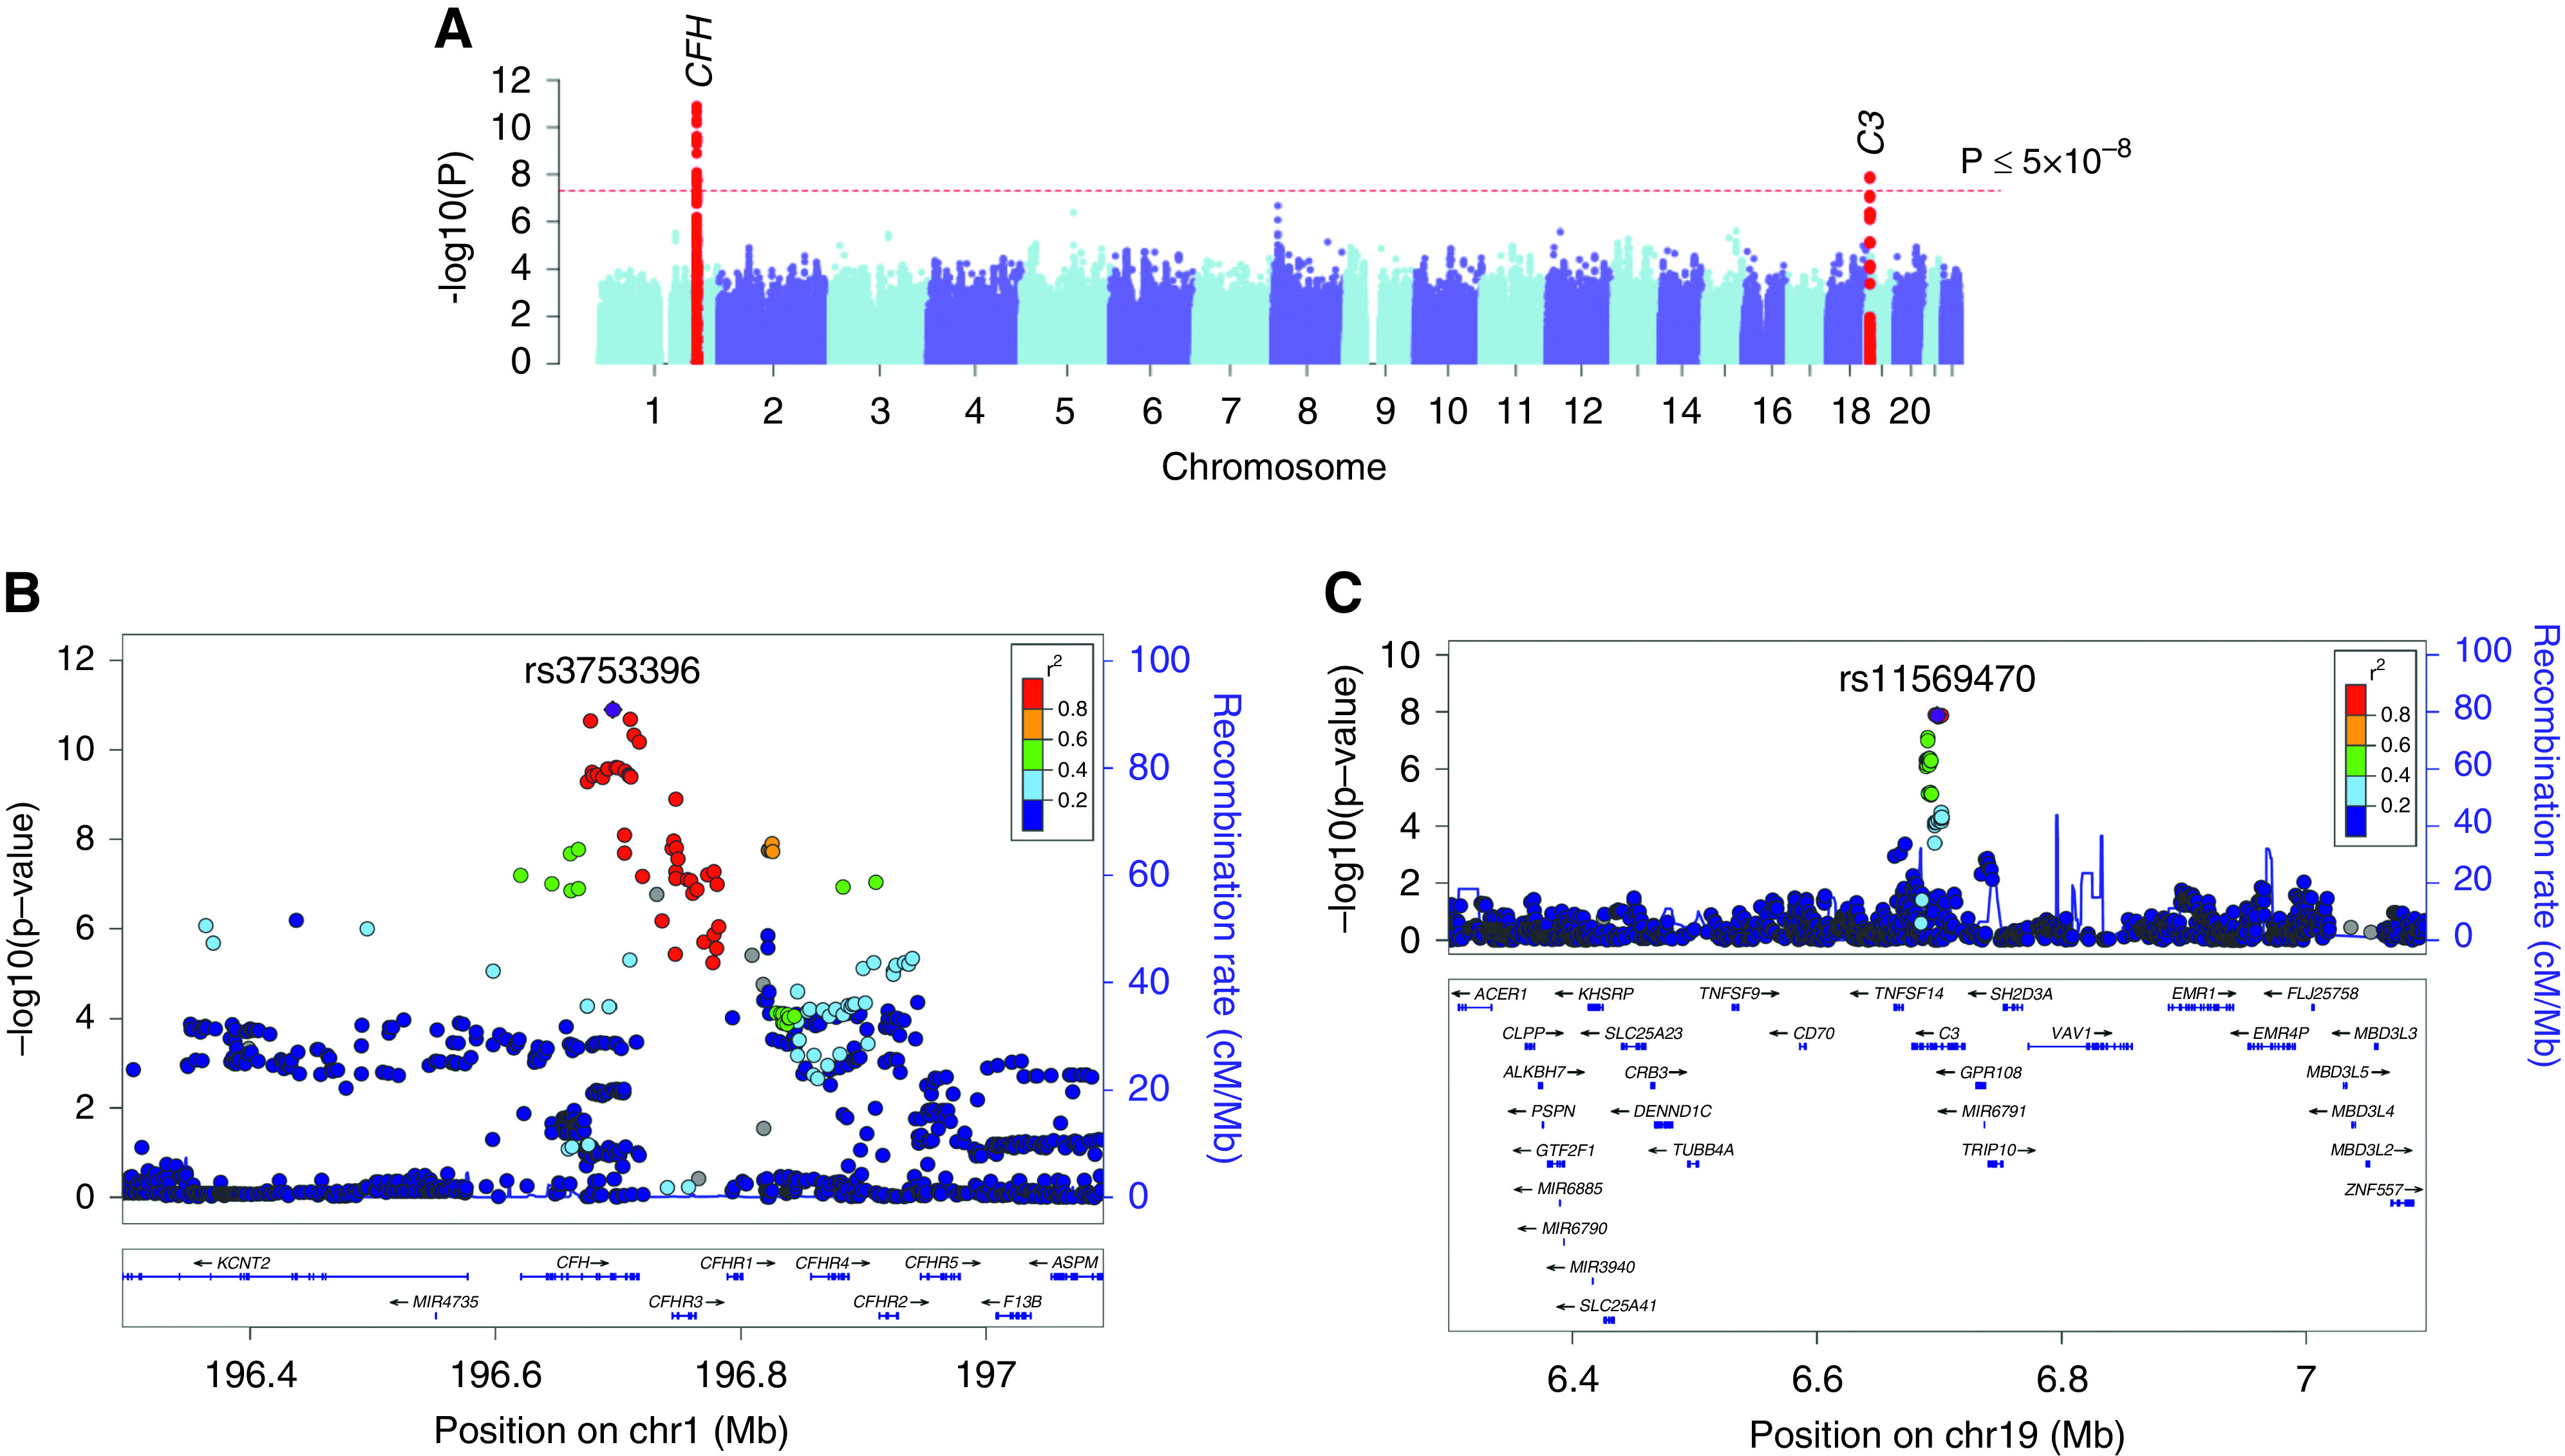
Figure 2.

GWAS for C3 levels. (A) Manhattan plot, (B) regional plot for the CFH locus, and (C) regional plot for the C3 locus. The y axis represents −log-transformed P values, and the x axis represents genomic position. The 1000 Genomes Europeans reference panel was used for LD reference.
