Figure 2.

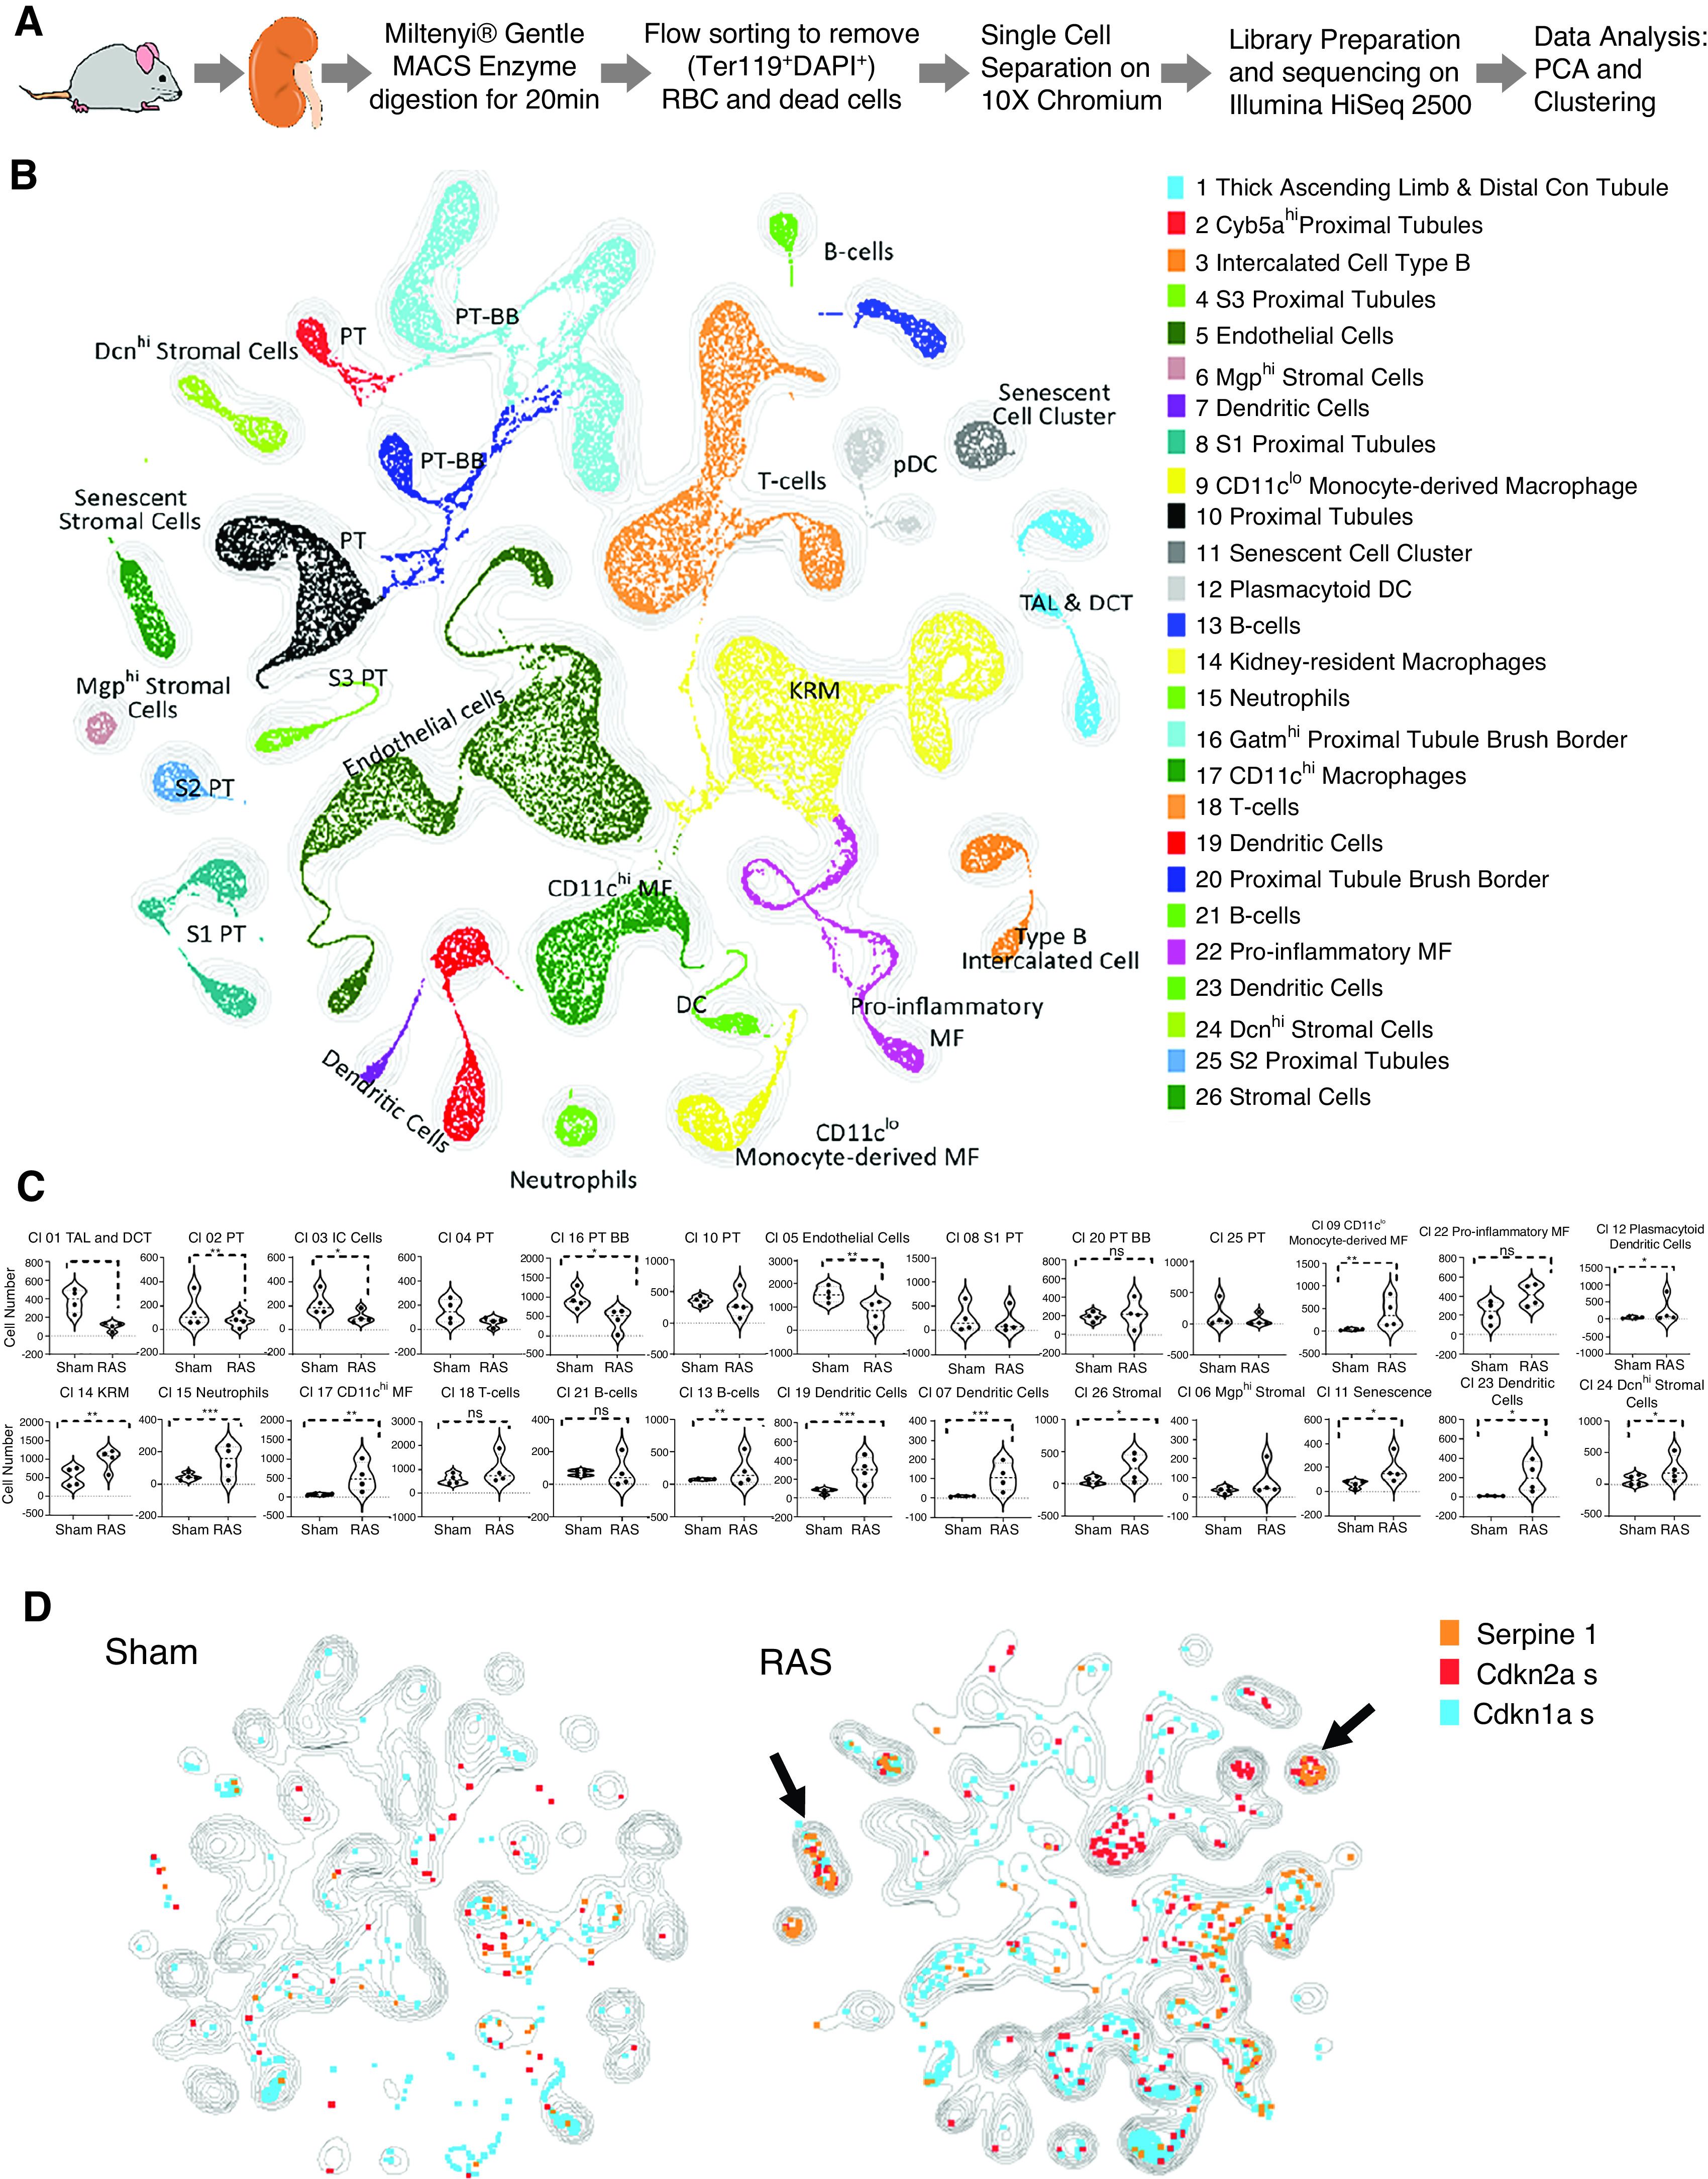
Clustering of sham and RAS kidneys by scRNA-seq illustrate cell types/clusters in sham and RAS kidneys. (A) Experimental design for isolating viable kidney cells. scRNA-seq data were analyzed together with all metadata. (B) Unsupervised KNetL followed by PhenoGraph mapping, showing 26 distinct cell clusters from 57,000 sham and RAS kidney cells. (C) Violin plots comparing the proportion of each cluster in sham and RAS samples. Individual populations were downsampled to approximately 7000 cells per sample, and proportions of individual populations per cluster were quantified (Mann–Whitney test). P<0.05 is considered significant. In RAS, cells were reduced in tubular and endothelial, but increased in myeloid and stromal clusters. (D) The contours illustrate and compare cell types/clusters between sham and RAS kidneys. Some genes are superimposed on these contours to highlight the cell types (listed in Figure 2B) that undergo senescence (Figure 2C) in RAS. Overlay of Cdkn2a+ senescent cells in sham and RAS show that most cells upregulating Cdkn2a are T and B lymphocytes, myeloid cells (macrophages [MF] and dendritic cells [DC]), stromal cells (arrow), and a senescent cell cluster (arrow). The senescent cell cluster (cluster 11) (arrow) expresses marker genes such as Serpine1, Cdkn2a, and Cdkn1a in RAS compared with sham. BB, brush border; Con tubule, convoluted tubule; DAPI, 4′,6-diamidino-2-phenylindole; DCT, distal convoluted tubule; KRM, kidney-resident macrophages; MACS, magnetic cell sorting; PT, proximal tubule; RBC, red blood cells; TAL, thick ascending limb of the loop of Henle.
